No matter what type of business you are in, there is no denying the importance of geospatial data as it relates to literally every area of your company from marketing to planning and everything in between. In terms of real estate, in the coming years any real estate agency that doesn’t make use of and rely heavily on geospatial data will almost certainly be left behind. In order to understand that rather marked and definitive statement, it is first important to understand exactly what geospatial data is, how it is collected, and why it is especially relevant in real estate.
In its simplest definition, geospatial data is that which is descriptive of any event, object or feature located on or very near the earth’s surface. It is typically a combination of:
Location (coordinates)
Characteristics (relating to objects, phenomena, or events)
Temporal Information (point in time or lifespan)
All of which play a significant role in reading data with the intent of forecasting future events or movement.
For example, let’s look at how geospatial data helped to track and forecast the movement and spread of the SARS-CoV-2, Covid-19 pandemic. Temporal data gave us a short-term location of what was to be the pandemic in late 2019. We know that the location was Wuhan, China and thought to have originated at one specific market which then became ground zero on the geospatial chart. From there a long-term progression of the pandemic showed its movement outward which are temporal and location data. Along with characteristics such as how it was spreading, scientists became better able to forecast its movement around the globe and as early asMarch of 2020 a global pandemic was announced.
Even then, it was too little too late because some of the much-needed data was not forthcoming soon enough to predict an accurate geographic spread and rate of spread. Had geospatial data been shared better in the early days, many virologists and epidemiologists believe the pandemic may have had better outcomes earlier on. With that, you can see just how important it is in forecasting business dynamics going forward.
How Real Estate Can Benefit
In the real estate market properties for sale have always been valued primarily on location and what we knew about that that particular property in terms of the condition it was in and what was going on around it in the general vicinity. Were there plans for future development and if so, how would that affect a particular property that an owner wanted to list for sale. Realtors and assessors would look at other properties in the area to see what they had sold for in order to relate that price to the property in question. This is how comparables were calculated and how an actual list price and marketability were determined.
With advances in technology, geospatial data can actually have a profound effect on the profitability of a piece of commercial property. Instead of using historical data to predict a given market going forward, temporal data gathered and analysed in real time can indicate what that property is worth today in the here and now. To be specific, comparables calculated even a week previous to a major break in a pipeline may not be relevant today. That property would be greatly devalued if the repairs would be weeks or months in coming. Real time data can affect the price today and that’s why the real estate market will, at some point in time, need to rely on what is happening on the ground at a very precise location.
Furthermore, leveraging advancements in real-time property imaging through tools like Giraffe360, agents can create immersive virtual tours and detailed visual content. This not only enhances a property’s appeal but also provides potential buyers with a comprehensive understanding before an on-site visit.
A Key Selling Point
Conversely, if new schools are being built, for example, and an influx of families are moving into a neighbourhood, a commercial venture for a theme park might want to jump on a parcel of land zoned commercial. Satellite imagery would show that kids are out playing in fields and on side streets with few parks and nothing in the way of entertainment. It would take weeks, if not longer, to collect that kind of data without the benefit of a literal bird’s eye view from above and a poor data set can have a terrible effect on the real estate market.
AI could possibly collect data on the types of commercial or public properties families might frequent already in existence, but even that isn’t quite as all-encompassing as actually seeing movement on the ground. Just because a property exists doesn’t mean it is being frequented by the locals. Satellite imagery would document that and indicate whether or not there is a need for family entertainment at this time.
Imagine what a real estate agent could do in the Greek Islands with information like that? As a popular tourist destination, geospatial data could indicate what kinds of attractions are being frequented, which are ignored, and what types of venues would do well in areas with currently high levels of traffic. It’s interesting to imagine just how this type of data can, and will, affect the real estate market going forward. One thing is for sure. Geospatial data will almost certainly replace the archaic system of buying and selling real property based on comparables. That’s a given.
When it comes to delivering a successful demand generation campaign, data and measurement are critical. While this should go without saying, it’s amazing how many companies still conduct their marketing without any clear visibility on their performance. Without access to the right metrics, marketing activity can’t be justified, evaluated or improved.
Just consider that for a second:
You want to provide accountability for your marketing spend…
You can’t.
You want to identify what went well…
You can’t.
You want to evolve to deliver better results next time…
You can’t.
I think you probably get the picture by now – measurement is a key component and it can’t be treated as an afterthought.
With that said, collecting, analyzing and acting upon performance data isn’t always simple. With so many pieces in play, understanding what is and isn’t working is critical to making reporting results actionable. Remember, collecting information is pointless unless it’s going to be used!
To embrace a data-driven approach in your demand generation campaigns, you need to take a methodical approach. The simplest way is to break down your approach into 4 stages; Discovery, Design, Deploy and Optimize.
The Discovery Stage
At the Discovery Stage, you should be focusing on what it is you’re trying to achieve and then identifying the metrics that influence that objective. So for example, take the likes of prospect conversions, cost per click (CPC) and return on investment (ROI), these are all different marketing metrics that offer highly valuable insight for various objectives within a demand generation campaign. Each will have varying importance based on the tactics and objectives within the said campaign and will require relevant prioritization as a result. In some campaigns, ROI may be irrelevant (unusual, but does happen), in others, prospect conversion rates won’t matter. It really all comes down to the objective.
For example, if you are looking to sell an exfoliator, then your campaign should consider the target audience, and then come up with the right metrics.
Unfortunately, many companies focus on the wrong metrics when it comes to measuring performance. They have the right mindset, but get lost in vanity metrics that don’t actually make all that much difference to the results that impact their objective.
For example, instead of looking at conversion rates on an asset landing page, they’ll look at the number of people arriving to the page. This creates a disconnect between the figures and the desired results. These vanity metrics look great on paper but aren’t indicative of success or failure, so don’t really offer a lot in the way of insight.
The Discovery Stage should be where you identify what metrics matter, the role they play in achieving your objective and why.
The Design Stage
Once the key metrics have been identified, you need to determine how they can be monitored and measured, and this is where the Design Stage kicks in.
Just because you know what data you want to focus on, it doesn’t mean you can effectively access that information. You need to think about what systems you have and whether they integrate well to provide accurate data?
In addition, you need to know if there are silos that prevent you from seeing the full picture. These are all factors that have to be considered carefully as you build your data-driven approach.
You can’t afford to be working from only a partial view on key data, particularly if that information is going to be used to guide future decision making.
In order to get the big picture, technology not only needs to be compatible but also effectively interlink together to ensure there are no anomalies that impact the validity of the data. Designing a system that gives you a full view of critical information is essential to taking a data-driven approach to your demand generation campaigns.
The Deploy Stage
With objectives identified and a clear understanding of how data management will work, you need to move onto the Deploy Stage. This is all about the practicalities of building the system that’s been designed.
You already have an idea of the information you want, why and how it will deliver value and now you need the technology and systems in place to ensure that information is easy to access.
Many companies underestimate how challenging this can actually be. Few consider the limitations of their legacy tech stack and many often struggle to take the right steps to overcome challenges.
Often it will require custom APIs, enabling systems to play nicely together. This is where the interconnected nature of demand generation campaigns can make measurement challenging.
Beyond achieving data accuracy, the Deploy Stage is also where you need to think about how data will be collected and visualized. Will it be gathered automatically in a centralized location or will each piece need to be manually collected? These are considerations that require further thought based on the needs and complexity of the project.
The Optimize Stage
At this final stage, your objectives are clear, your system is designed and built with the relevant data collection capabilities and integrations. Now, it’s about analyzing and using that data, and this is what the Optimize Stage is all about. In this stage, you will be reviewing your key performance metrics and developing actionable conclusions.
This may involve trend analysis, or focus more on recognizing anomalies, it really depends on the metric and the objective. Whatever the case, the outcomes of any evaluation should be actionable and designed specifically to improve future campaign performance.
Some demand generation campaigns fall down due to the failure of a single component and so optimization really is key. If one metric in particular is undermining the rest of a campaign, this stage can turn a struggling project into a powerhouse.
With the ability to A/B test most changes, it’s easy for iterations to be made and trialed with a small test audience before deploying them across the entire campaign. This not only helps to maximize the impact of changes, but encourages experimentation with alternative approaches.
Driving your demand generation campaigns with data
Running a successful demand generation campaign can be tricky, but with a data-driven approach, companies can quickly identify what works and why. This helps to build fully justified campaigns that can be iterated upon to drive performance and ROI.
With the right data points to hand, at the right time and in the right format, campaign performance can be reviewed in real-time, unlocking the opportunity for regular changes and improvements.
Data can turn your demand generation campaigns into ‘live’ assets that adapt as and when required to achieve their objectives. This ensures every component is working to its full potential and delivering the necessary results to drive the metrics that really matter. Using the ‘Discover, Design, Optimize, Deploy’ model you can take your first steps to achieve a data-driven approach in your demand generation campaigns.
As the world remains gripped by the threat of COVID-19, questions over community spread, and prevention tactics loom large. Did cities and representatives do enough to stop the spread of the virus, or could they have done more?
An estimated 68% of the world’s population will live in cities by 2050, which makes urban development’s role in disaster response essential for protecting the population.
Cities and other population-dense areas have been flagged as one of the major issues impacting the virus’ community spread. Yet, smart cities may have also helped slow the spread of the virus in Chinese communities such as Wuhan.
China has 500 smart cities currently underway, and while the question of whether this smart technology has helped slow the spread of the virus in Chinese communities remains up for debate, here are some ways the urban planning of smart cities could help defend against pandemics.
Disease tracking
Disease tracking can be one of the biggest defenses against virus spread as it allows scientists, researchers, and city officials to analyze real-time data to make informed recommendations. So how does it work? This data-tracking system uses artificial intelligence to track the spread of infectious diseases.
Big data and natural language processing make it possible by allowing companies to track the spread of information from hundreds of thousands of sources.
A disease tracking company based out of Canada known as BlueDot was the first to sound the alarm about the novel coronavirus, even before any world health organization informed the public. On December 30, it noticed a cluster of “unusual pneumonia” cases in Wuhan and alerted its customers of the outbreak.
Autonomous delivery
One lesson the world is learning from COVID-19 is the importance of social distancing. Because COVID-19 can live on some surfaces for up to 3 days, restricting access to public areas has been deemed essential in cities across the globe.
Autonomous delivery systems would eliminate the need for drivers to deliver supplies and goods, such as food. Technological advancements such as delivery drones and driverless trucks will make this process more seamless in years to come. Incorporating these technologies into smart city management will give local governments more control over delivery systems to prioritize needs, for example delivering medicines before goods.
Geolocation
Many of our phones are already tracking our location-data, but what if our local governments used this information to make predictions during pandemics? Data companies such as Tamoco make tracking and predicting behaviors easier than ever for marketing and intelligence purposes.
One example of how geolocation data can be useful during a pandemic is by analyzing popular shopping times. It can even be used to understand which houses are for sale in Chatsworth California. City officials could use data around when people are most likely to shop for groceries and goods to help make decisions about store hours and restrictions, and when to establish senior hours.
Drone surveillance
While the application of robot surveillance is controversial, it has helped countries like China monitor citizens during the coronavirus outbreak. Rather than sending police officers out to monitor cities and streets where shelter-in-place orders are in effect, cities can send out drones to survey the areas and make sure citizens are abiding by city ordinances. Insect drone technology is fast becoming a powerful tool for cities to utilize.
Thermal cameras
Another technology the city of Wuhan used in its fight against the coronavirus is thermal cameras. While the technology hasn’t been perfected yet, these cameras, which also feature facial recognition software, can detect body temperatures in citizens passing by.
Since a fever spike is one of the most common symptoms of the coronavirus, these thermal cameras could, in theory, alert city officials when infected members of the population were out walking the streets, potentially spreading the virus.
Internet connectivity
In the age of information technology, the best way to stay dialed in is by staying online. Cities such as New York City have already activated smart technology that gives all citizens internet access in public places. This allows citizens to stay informed during times of crisis, no matter how much they make or whether they pay for WiFi at home.
Giving everyone access to the Internet allows for local city leaders to communicate with their citizens and get public information out faster. Many smart cities also have information kiosks and robust telehealth services that can be updated instantly to spread awareness as situations develop.
One of the scariest parts about the novel coronavirus is the lack of data researchers, scientists, and leaders have. Smart cities that collect data in real-time can revolutionize pandemic responses by making data available faster, and we’ve seen examples of this in action as China utilized their city technology to help fight the spread.
Smart cities can also help cities conserve energy, manage traffic congestion, optimize waste removal, and improve water and energy management. To learn more about how smart cities work, head to The Zebra.
This post is a contribution by Karlyn McKell
Karlyn is a writer who specializes in the technology and insurance spaces. She believes the best ingredients for success are passion and purpose.
Big data plays a crucial role in many industries, and event management is just one of them. People all across the world are relying more and more on their smart devices, and it has become increasingly easier for event organizers to gather and use data to cater more directly to event attendee’s experiences.
Event planners are leveraging big data to deliver highly personalized events and boost attendee engagement. In this article, we’ll look at some of the ways you can use big data to provide better event experiences and learn more about your audiences’ needs and expectations.
Let’s put everything into context before we begin.
What Is Big Data?
Generally speaking, big data refers to the enormous volume of data that is collected daily. The data itself doesn’t necessarily have to be useful on its own. It’s the insights, trends, and patterns the data reveals that event planners are most interested in.
For event organizers, big data analysis involves collecting vast amounts of data from their attendees, sponsors, and target audience. This might be in the form of emails, surveys, tweets, photos, or location data.
Event planners can use big data to organize attendee-centric events, increase attendee engagement in real-time, and deliver enhanced event experiences.
The good news is that implementing data analytics in your event planning doesn’t have to be complicated. You can work with the data sets that are already available to you and extract valuable insights from them.
If you’re not collecting any data from your target audience or attendees, the first step is to identify the key data points you’re most interested in. For example, if you’re hosting a business conference, you will need to know where attendees are traveling from so you can provide each attendee the best advice for lodging and commuting to the event venue.
Now that you know what big data is and why it’s important for event organizers, let’s look at how you can implement big data in your event management business.
Promoting your event takes up a lot of monetary resources, which is why you need to make sure you can cost-effectively maximize your audience outreach. By gathering and analyzing data on your attendees, you’ll be able to find ways to connect with them.
For example, attendee surveys might indicate that most of the respondents first learnt about your event from your social media pages. So, instead of focusing on company spending on offline marketing strategies, you might consider spending more on your social media campaigns.
Location data {information about geographic positions of devices such as smartphones or tablets} allows event marketers to connect their digital marketing efforts to how prospective attendees behave in the real-world. As a result, event marketers can provide even more personal advertising to their target audience.
To attract more attendees, you need to ensure that you’re advertising to the right audience; otherwise, you might experience a drop in event attendance and audience engagement. Analytics can help you discover when your target audience is actively using social media, what is the best way to connect with them, and how you should craft your message to get their attention.
Big data can help you identify what your prospective attendees respond to, which you can then use to improve your event planning. Having access to this information will not only help you customize your ads to attract more attendees but will also be useful in delivering personalized event experiences to your guests.
#2: Gaining Insight from Analytics
Analytics can help you figure out the specific topics and themes that most interest your audience, the guest speakers they want to listen to, and any tools or presentation technology they’d like you to implement in your events.
By gaining access to the right information, you’ll be able to discover their pain points and what your guests expect from your events. Start by collecting online search data or using pre-event survey forms to gather this information directly from your attendees. Similarly, you can search through social media sites, community sites, as well as this you can make use of powerful location intelligence and analytics to reveal your attendees’ motivations.
Big data can help you identify the different factors that affect audience behavior and leverage them to your advantage. You’ll be able to predict trends months (or even years!) into the future. Predictive analytics lets you make near-accurate guesses and allow you to see which existing topics have growth potential so you can jump on them before your competition.
Google Trends is also an excellent tool for discovering what your prospective attendees search for. By comparing search terms with historical data, you can predict what will be popular in the future, and when you should host an event around it.
#3: Personalizing Attendee Experiences
The data you collect from your attendees gives you insights into how you can enhance attendee satisfaction. You can use technologies such as location data, RFID, VR, and beacons to deliver unique event experiences.
For example, you can send information to nearby devices using beacons, allowing your attendees to only focus on the booths they’re most likely to be interested in. This is also a great way to offer location-based experiences to your guests.
Pepsi organized a dance party at SXSW, where dancers wore wristbands that would gauge their reaction to a stimulus. The wristbands measured body temperature, the volume of music, body movement, as well as the physiological arousal through body sweat. This information was used by the event’s DJ to figure out what music people loved the most. In addition to this, it enabled the crowd to control lighting, bubble machines, and smoke machines.
#4: Crowdshaping
Another way big data can help you improve your event planning efforts is by letting you better manage crowd densities at the venue, also known as crowd shaping. It’s an effective way to make sure attendees can enjoy your events without openly influencing their behaviors.
For example, if you see a crowd of people around the book signing tables, you may decide to extend the time allocated for that particular activity in real-time. If a guest speaker is about to take the stage, you can send out notifications to let attendees know that they can get their books signed after the lunch break.
In addition to this, you can use data from past events to improve upcoming events. For example, if data from one event indicates that attendees like open spaces to walk around during breaks, you can use this information to book future venues with plenty of extra space.
In its simplest form, geolocation is capable of giving you information about the location of a person. Beyond that, it can be used by event organizers to gather crowd density data about events. This allows them to manipulate crowd flow more effectively.
Crowdshaping and big data come together to help you identify problems in your crowd flow and enable you to solve them by making proper adjustments quickly. In the long run, this information will allow you to make better event planning decisions (such as opening more check-in lines) and go for venues that meet your audiences’ specific needs.
Event organizer at C2 Montreal gave RFID badges to their attendees that collected their location data. This allowed organizers to see where the majority of the attendees gathered and which event places received less traffic. They found more crowds near food tables, which led them to send more food service staff to those places.
Conclusion
The data you gather on your attendees is a valuable resource that can help you improve your event experiences. You can always start small and use whatever data you have to learn about your audiences’ needs and expectations. With time, you’ll feel more comfortable collecting and working with big data.
Event Espresso lets you collect, control, and own all the data you collect for free. You can export your event attendees’ data into Excel or CSV format and use it however you want.
This guide will tell you everything that you need to know about location data:
Introduction
The global adoption of smartphones has grown at incredible speed in the last decade.
Mobile devices are a powerful tool for understanding the aggregated behavior of consumers.
Understanding device location opens doors to a wide range of use cases that are unique in many different ways.
Mobile location data provides a granular solution for consumer understanding. Combining this understanding with other datasets is helping to solve business problems and achieve goals across many different industries.
Many companies are now partnering with a nearshore software development center to build advanced platforms that can process and analyze mobile location data efficiently, ensuring faster deployment and closer collaboration across time zones.
For these reasons, location data has quickly become the holy grail of mobile. Its applications are broad and run across a number of different industries and verticals.
But before we get onto that, what exactly is location data?
What is location data?
The smartphone
The mobile device or smartphone has been revolutionary. Its growth has been incredible – many predict that there are now more of these devices in the world than there are people.
Smartphones have transformed everything about our everyday lives -we rarely leave home without it, and it’s always on our person, ready to provide us with instant information or guidance.
These devices have enabled the location data industry to understand how audiences move and behave in the real world. This information is location data. It comes in many different forms and from various sources.
What is location data?
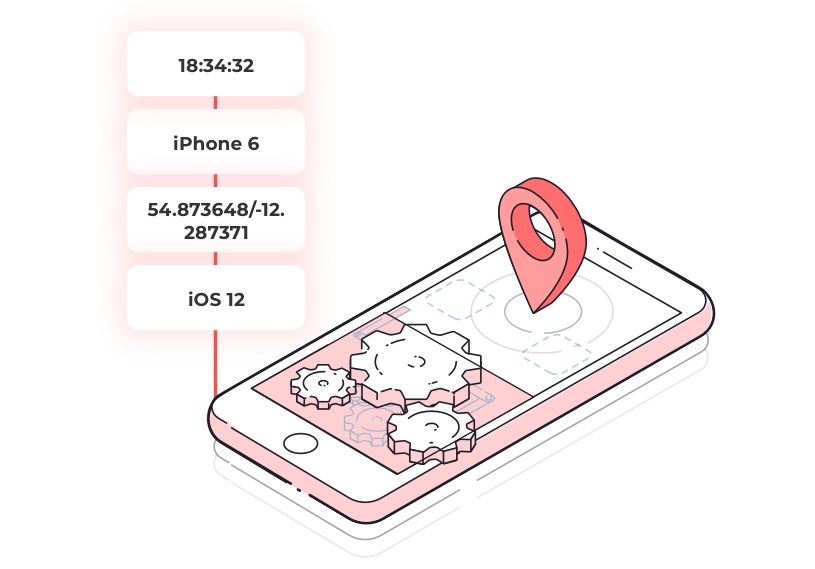
Location data is geographical information about a specific device’s whereabouts associated with a time identifier.
This device data is assumed to correlate to a person – a device identifier then acts as a pseudonym to separate the person’s identity from the insights generated from the data.
Location data is often aggregated to provide significant scale insights into audience movement.
How is location data generated?
Companies are collecting location data in many different ways. There are several different techniques to collect location data. These techniques differ in reliability (but more on that later).
For now, the primary process of collecting location data requires the following ingredients.
A location source/signal
The first ingredient is a location signal. This signal is not a product of the device itself – it comes from another piece of technology that produces signals. The device listens to these external signals and uses it for positioning. These signals are as follows:
GPS
GPS is shorthand for the global positioning system and was first developed in the 1970s. The system is made up of over 30 satellites which are in orbit around the earth. This technology works in your device by receiving signals from the satellites.
It can calculate where it is by measuring the time it takes for the signal to arrive.
GPS location data can be very accurate and precise under certain conditions, mostly in outdoor locations. In the best instances, the signal can be reliable down to within a 4.9 metre radius under open sky (source) .
Wi-fi
Wi-fi networks are another source of location signals that are great at providing accuracy and precision indoors. Devices can use this infrastructure for more accurate placement when GPS and cell towers aren’t available, or when these signals are obstructed.
Beacon
Beacons are small devices that are usually found in a single, static location. Beacons transmit low energy signals which smartphones can pick up.
Similarly to Wifi, the device uses the strength of the signal to understand how far away from the beacon it is.
These devices are incredibly accurate and can be used to place a location within half a meter with optimal signal strength.
Carrier data/cell towers
Mobile devices are usually connected to cell towers so that they can send and receive phone calls and messages. A device can often identify multiple cell towers and by triangulation, based on signal strength, can be used to place a device location.
An identifier
Each smartphone needs to be associated with an identifier to understand movement over time. This identifier is called a device ID. For iOS, this is called an Identifier for Advertising (IDFA), and for Android, it’s called an Android Advertising ID (AAID).
Meta data or additional dataset (optional)
A location signal combined with an identifier will allow you to see the movement of a device over time. However, for more detailed insights and to get more value from location data, you’ll need some metadata or an addition dataset.
The most common dataset to do this is a POI dataset. This dataset includes points of interest that are important when comparing how audiences move and behave in the context of the real world..
For example, a series of latitudes and longitudes showing how Londoners move between 7-10am could be useful. Tying this to a dataset that included tube stations and key travel routes would allow you to do much more with the initial data.
Location data sources – where does location data come from?
So, we have already looked at the ingredients that combine to make location data, including the different types of location signals. However, what are the sources of location data? If you are looking to use location data in your organization, then you need to know the differences between every potential source. It’s also important to have a data governance strategy to manage the data effectively.
The source can have a significant effect on accuracy, scale and the precision of devices. So, from where does location data come? There are three primary sources:
The bidstream
A sizeable proportion of location data comes from something called the bidstream (also referred to as the exchange). The bidstream is a part of the advertising ecosystem. Don’t worry if you’ve never heard of this – we’ll explain everything.
Explainer: The ad buying ecosystem
The ad buying ecosystem
Before we talk about bidstream data, it’s helpful to understand how ads are bought and sold.
Direct deals with publishers such as an app, site, or network.
Ad networks which group ad inventory to sell it to advertisers
Ad exchanges provide a solution for publishers to offer up their inventory programmatically, allowing advertisers to buy it in real-time. Purchasing advertising inventory in this way produces a bid request.
Why is this relevant for location data I hear you ask? In every bid request information is passed on – this data contains several attributes used to determine whether to serve the ad on the device.
Included in this dataset is a form of device location. A company will package up this location data, and the result is the bidstream location data that is available today.
Bidstream location data is appealing because of the sheer amount of it – it can very quickly provide a large amount of scale. However, bidstream data also comes with specific issues – it can be inaccurate, inconsistent, and even fraudulent. Because it’s captured programmatically ,then bidstream location data also has the benefit of being immediately actionable.
“Up to 60% of ad requests contain some form of location data. Of these requests, less than a third are accurate within 50-100 meters of the stated location”
Telcos
Remember, in the last section, when we identified location signals? Cell tower location is one of these and is the process of triangulating the strength of mobile cell tower signals to place the device in a specific location.
This kind of location comes directly from a telecommunications company (telco). Usually, they have some demographic data associated with the location data.
Similarly to bidstream data, the scale that telcos can offer (they have an extensive reach as in many countries few companies serve the entire population) is appealing.
However, in the same way, this scale is masking many issues with the accuracy of the data. Some studies have found that as little as 15% of data sampled was incorrect.
Location SDKs
A software development kit (SDK) is a toolkit that app publishers can add to their app to provide third party functionality. Developers add location-based SDKs to their apps to access the most precise and accurate location data signals from the user’s device.
Location SDKs come in many shapes and forms – some make use of the core location functionality present in the OS, others do a degree of data processing on top, to boost accuracy.
Some SDKs only operate in the integrated app when the app is open. Others can run in the background to gain broader insights into the movement and behaviors of the device.
Location-based SDKs collect data with the user’s consent – the apps native permissions often collect this consent, but some SDK providers offer consent tools to ensure that the location based app is collecting data in accordance with relevant regulations.
The difference between SDK generated data, and other sources of data can be seen in the accuracy and precision of datasets. Data collected by location SDKs are more accurate because they can listen for multiple location signals.
For example, SDKs can use the device’s built-in GPS to place the device and then, using Bluetooth signal strength from beacons, verify and fine-tune the location of the device down to within a meter of accuracy.
Location SDKs usually have a more sophisticated way of understanding how the device is behaving. For example, the Tamoco SDK uses motion behavior and other entry/exit events to know when a device visits a venue or location.
Why isn’t all data collected using SDKs?
If location SDKs are the most accurate and highly precise, then why don’t we use them to collect all location data?
The issue with many location SDKs is that they require integration into a publisher’s app. This app then needs to cover an adequate number of devices before the data is representative enough to gain any valuable insight or relevant patterns.
However, some SDKs have been built with functionality that benefits the publisher and limits battery usage to a minimal level. These SDKs are the ones that have achieved significant scale.
For example, the Tamoco SDK is optimised to send data in batches to minimise the number of requests. We also modify how data is collected depending on the current battery level.
All of these factors are a direct result of a close working relationship with our developer partners and allows the Tamoco SDK to scale along with our partners.
Publisher datasets
It’s possible to obtain location data directly from app publishers. Some publishers have developed methods of obtaining location by using the devices inbuilt location services.
These will usually coincide with a location-based process within the app – such as looking up a nearby restaurant.
These are often not as accurate as the location SDKs that have been carefully built to collect verified location signals. However, they can be a good source of location data as long as you can validate and understand the process of data collection put in place by the publisher.
We’ve already said that good location data is accurate and precise. However, let’s take a step back and ask ourselves a question – what do we actually mean by accurate and precise location data?
Location data collected by smart devices usually come in the form of a latitude and a longitude coordinate, or a lat/long. This reading refers to the perceived location of the device at the time.
However, how can we make sense of this number and understand if it’s accurate?
Location accuracy v location precision
You might think that accuracy and precision can be used interchangeably. However, in the world of location data, they have different meanings
Accuracy
Accuracy is a measurement that helps us to understand how close the device’s geographical reading is to the actual location of the device.
So how do we measure accuracy? The location accuracy of the device changes depending on the type of signal and the device. Accuracy is measured by looking at the signal type (GPS, wifi, cell tower). The device provides us with a reading of the location and then an accuracy rating. This unit is usually a measure of distance and is the margin of error associated with the measurement.
Precision
Precision is the level of detail associated with the location measurement. The more this is is similar to the other measurements in the dataset, the more precise the data is.
In location terms, we use lat/long to measure this. Firstly we check to see if the data points are realistically within the same area.
The number of decimal points in the lat/long is essential in measuring the precision of location data. The more digits there are after the point, the more precise the data is.
The following table helps to explain precision when looking at lat/long:
Decimal Places
Decimal Degrees
DMS
Qualitative Scale
0
1.0
1° 00′ 0″
Country or large region
1
0.1
0° 06′ 0″
Large city or district
2
0.01
0° 00′ 36″
Town or village
3
0.001
0° 00′ 3.6″
Neighborhood, street
4
0.0001
0° 00′ 0.36″
Individual street, land parcel
5
0.00001
0° 00′ 0.036″
Individual trees, door entrance
6
0.000001
0° 00′ 0.0036″
Individual humans
Not all mobile location data is equal
As many in the industry have stated: the type of location data and methodology is of significant importance. The relevancy of different kinds in different scenarios is often contented.
Mobile location data requires some fundamentals to provide granular insights that we discussed earlier.
So what’s the best way to accurately and precisely collect location data and what happens when signals such as GPS aren’t working?
We think this is another argument for SDK generated data. For example, the Tamoco location SDK can listen for multiple signal types simultaneously. Processing these signals allow the SDK to measure accuracy and then determine which signal to use.
Our SDK, therefore, uses Bluetooth and Wifi to help position the device in areas where GPS signals are weak. This sensor agnostic approach means that the SDK can place the device with better accuracy and more precision by using multiple signals.
Remember, when we talked about the three main ingredients that combine to produce location data. We’ve covered the device and its identifier. We’ve also covered the signals that the device used to position itself.
However, we are yet to cover the additional data that is needed to make use of the dataset. As we have discussed location data is usually a lat/long associated with a device and a timestamp.
We need to understand what this location is to make any use of the data. Knowing a device location is half of the challenge. To do this, we use database that allow us to connect this online data to the offline world. We call this a POI dataset.
What is POI
A point of interest (POI) dataset is a data representation of the physical world. A single POI is a geographic boundary and is usually associated with a physical location (think a store or building).
As with location data POI datasets come with a series of challenges including accuracy. Business regularly move, and as changes happen in the real world, the datasets evolve accordingly.
At Tamoco, we set up our own Place database to explore-in-depth how devices move and behave in the offline world. This database is slightly different from a POI dataset.
Explainer: Tamoco places
Contains metadata associated with the place – opening hours, floor level, polygon footprint and other essential information that can help to verify if a device entered the POI.
Combines with an associated geographical boundary (geofence) that can be used to understand the device activity inside and how long it stays inside.
Combines with any known sensors (beacons, Wifi, or other signal based tech) to help understand when a device is visiting the POI and not in fact staying in a place nearby.
What’s the importance of POI?
Perhaps the best way to understand the importance of a useful POI dataset is by using a real-world example.
No POI
In the above example, we don’t have a POI dataset. We have multiple lat/long, which might be accurate and precise, but we get no value from this as we have no connection to the real-world.
Bad POI
Here we have a POI dataset which connects the lat/long to a physical location. However, the POI is slightly in the wrong place, which means we think the device has visited the coffee shop, but they are waiting outside, or elsewhere. The implications of this will become more evident in the next section.
Places database
Here we have a place with opening hours and altitude. We have a geofence which allows us to see when the device enters and exits. We also have a Wifi and beacon sensor that we know is inside the coffee shop. Using this, we can verify with accuracy that the device was inside the place.
Connecting location to POI
At Tamoco, we do this through a process called visits. This methodology is a powerful data science technique that allows us to validate whether the device is inside a place and to say with a level of accuracy how long a device was inside.
Where other data providers will claim a device is inside a store if a single lat/long shows up inside a POI, we go much further.
What happens if this single data point is an outlier from a car driving past. What if the POI is in the wrong place?
Tamoco uses essential device information (yes, this is possible only by using a location SDK) such as motion type to verify visits to a place and filter out any false visits.
Location data use cases – how to use location data
Hopefully, by this point, you will have understood more about how location data is collected and how device location is used to understand the connection between online and offline.
However, what are the uses for accurate and precise datasets? How can your business benefit from adding location data to your business? How do you integrate this data effectively?
Segmentation and targeting
Marketers are always looking for ways to identify relevant audiences for their advertising campaigns. They want to segment their audiences as much as possible to maximize campaign relevancy and convert more users into paying customers.
Location data is an effective and unique method to achieve those goals. The reason for this is that location is a significant indicator of behavior, interests, and intent.
For marketers, the patterns that you exhibit can be used to create a very detailed image of what you look like as a consumer. Location data helps to create an accurate representation of your interests, and this can be used to bring more targeted and relevant ads to potential customers.
When using location data to target audiences, there are a few things to consider. Depending on the business and the campaign marketers may use a different combination of each of these in a single campaign.
Real-time v historical
Marketers might want to run a different campaign depending on the kind of data available to them. One way that they do this is based on time.
Realtime
Realtime location-based targeting involves identifying when a device is in the desired location and usually involves a mobile targeting. The process is simple – when the user is in the desired location, deliver an advert instantly on that users device through programmatic advertising.
Historical location targeting
This form of targeting is usually called retargeting, and it is similar to real-time that we discussed above. The difference is that over time, the devices that appear in a predefined location are used to build an audience. The advertiser will then retarget this audience at a later date.
Visits vs interests
Visits
Targeting based on visits is a clear way of building an audience that has visited real-world locations such as a specific coffee shop.
Depending on the value of the POI database this can be extended to include devices that have visited all of the stores across a brand (for example every Starbucks) or every visit to a type of venue (example – visits to coffeeshops in Austin).
Interests
Using location to target people based on interests is another way of reaching a highly specific audience. This method is similar to visits but usually consists of several repeat visits to a location or combined visits that fit particular criteria.
For example, an interest-based target audience, such as big coffee drinkers could contain devices that have visited any coffee shop at least three times in a weekly period.
Another example could be active consumers – these could visit both a gym and a health shop within a month.
Interest-based location targeting is interesting because you can create very specific segments. However, as with other aspects of location-based targeting, the more specific you get, the less scale you can achieve with your campaigns.
Channels for location-based targeting + examples
By combining these, you can create highly targeted audiences using location data. But how do you then reach them?
Programmatic
Using device identifiers marketers can feed relevant devices into their programmatic stack to automatically buy ad impressions and target the desired devices in near real-time.
The same data can be used to retarget at a later date in a social feed or via another programmatic channel.
The benefits of this strategy are that you can automate a lot of the marketing process. By using location-based audiences, you can ensure that you are reaching the right audience with the right message.
Tamoco offers these as pre-built segments (both visit and interest based) that can be activated directly in your DSP for targeting, or in your Data Management Platform (DMP) for combining with other data sources.. This process can be used to reach consumers across several programmatic channels and on different devices.
Some examples
Drinks brand targeting consumers in real-time when they visit a venue.
In this situation, we would identify several venues that stocked the relevant products. By feeding visit data into the programmatic stack, it is possible to deliver mobile ads to the device while that visit is going on, or after the visit has occurred. This ad could appear in-app inventory or while browsing the web on the device.
Retargeting through social visitors to gyms with a health drink
Here visits to the category of gyms would be used to build an audience. Next, we would feed the audience into the social targeting platform (facebook ads or similar). The campaign would deliver the retargeting ads to the consumer in their social feed.
Targeting a competitor’s bank customers with a better offer
In this example, devices seen inside a competitor bank are targeted with advertising intended to initiate a switch to a new bank. The data would be historical and might include multiple visits to verify the person is a customer. This data could be used as part of a campaign across several different channels, depending on the marketing stack.
What about location-based segmentation?
The examples we have given include building a new location-based audience to feed into targeting solutions. However, the same principles can be applied to an existing audience.
For example, you can use location data to segment your audience into more specific segments and tailor each targeted ad to be more relevant to each segment.
Personlization & engagement
Today’s consumers demand a high level of personalized communication. Location data can help to bridge the gap between communication and personalization.
Location data can help to personalize ads and messaging to new customers. It can also help to personalize the customer experience.
Consumers want personalization, and everyone from marketers to product designers wants to deliver it.
Location-based marketing personalization
In marketing, location data can help to personalize ads, changing the creative for segments of the audience. This personalization is done by segmenting the ad audience based on location data behavior. These segments are then used to deliver creatives that are relevant to their behaviour – think ‘enjoyed your coffee today’?
Tailoring the ad message boosts personalization and boost the key metrics that marketers are always looking to improve
Location based engagement
Location technology can also be useful for personalizing the customer experience. Integrating a location SDK into your consumer-facing app can support location-based personalization, boosting engagement and retention in the long term.
For example, you can deliver contextual notifications when a user is in a relevant location. Remind users of items left in their app basket when they are nearby to a physical store, for example.
Using location to predict what your customers want
The data that marketers now have at their disposal has enabled them to do more than just personalize based on past consumer behavior.
Location datasets can take personalization to the next level. B2B content marketing personalization is becoming predictive. Brands and advertisers can now combine multiple data sources to understand how consumers behave on both a micro and macro level.
Using this information, it’s possible for marketers to become predictive with their personalization.
Marketers can continuously update their perceived customer profiles with data that explains a consumers profile clearly. This process helps the business to personalize the consumer journey and remove potential barriers to purchase.
Measurement and attribution
As we have seen, the world of marketing and advertising can benefit from using location data in their targeting, segmentation, and personalization strategies. However, location data is valuable in another area where marketers have struggled – attribution.
Advertising is usually quite easy to measure in the online world. If a consumer clicks an ad and makes a purchase, this can be measured and attributed pretty accurately to the ad.
However, what happens if the goal is a store visit instead? Marketers have been scratching their heads for years trying to solve this conundrum. Location data is the missing link that can connect the two.
Location data can act as the link between the online and offline, linking a digital programmatic ad to a store or venue visit.
This link allows marketers the ability to measure and quantify the return on investment from their campaigns. The same capability is useful for out of home (OOH) providers who are looking for a way to link their real-world ads to digital or physical conversions.
It always goes back to accuracy and precision
Location-based measurement and attribution are useful, but it requires data that accurately represents a consumer’s real-world behavior. This data needs to be more than just a single data point – marketers need to know with certainty that a store visit is attributed to an ad to measure ROI effectively.
This requirement is another argument for a place visits methodology that we have already discussed. Device characteristics such as motion and dwell time are essential in providing an online-offline attribution solution that accurately links digital ads to store conversions.
Examples
Digital campaign attribution
An agency is running a campaign for a clothing brand. The campaign is delivered to audiences programmatically. The campaign aims to drive footfall to stores stocking a new range.
The impressions and clicks can be measured by the agency, but the brands want to know if the campaign is driving customers to their stores.
Using location data and matching against the IDFA/AAID’s targeted during the campaign, an exposed audience is created. A control audience is also built to compare the exposed group against users who weren’t targeted during the campaign. By having an exposed and control group who were equally likely to visit the clothing brands stores before the campaign, it is possible to isolate the impact the advertising had on store visits by seeing how store visits between the groups move during, and for a period after, the advertising period.
OOH
A brand runs an OOH campaign across multiple OOH sites and wants to understand which of these was the most effective in driving online purchases, or whether the OOH advertising was driving online purchases in the first place.
Through an accurate understanding of where the OOH sites are located, and by accurately and precisely understanding how a device moves in relation to the site (an accurate view of this needs to factor in how much time a device spends close the site, how fast they move past the site and a number of other factors the Tamoco SDK factors in) it is possible to build a group of devices that were likely to have been exposed to the OOH advertising.
These devices can be compared to similar devices that weren’t exposed to the advertising, and their device identifiers can be matched to customers in the companies CRM or DMP to measure the impact the OOH advertising had on store purchases as well as which of the OOH locations was the most effective in driving purchases.
Analytics and insights
Location data is a useful tool to analyze how large numbers of people move and behave to identify large scale trends and patterns.
These kind of insights are usually difficult to attain at scale in the offline world. Location data works as an indicator of where people go and how they behave – and how these change over time.
In the realm of advertising and marketing, location-based analysis can deliver valuable insights, such as:
Comparisons between brand, category, or another group of physical locations over time. Such models will look at the footfall changes over time.
A brand can use location data to understand more about its customer demographics – where they live and work, where else they shop
Insights into their store performance – average unique visits per month, number of repeat visits, average visit length.
This analysis can be used for a variety of adjustments. Including changing campaigns to suit the real-world behaviour better, to fundamentally changing market strategies to match the data of how a customer is behaving in the real world.
Beyond advertising
These same insights can be applied outside of the marketing and advertising vertical. Using footfall can be useful across a range of industries including retail, finance, real estate, healthcare, and government.
Retail
Location data can be useful for both smaller and large retailers. Understanding store visits, as well as customer behavior through mobile device data, is having many positive effects on the retail sector. These insights can help inform business decisions such as store layout, opening times, staffing, and more.
Finance
Location data is an essential tool for finance analysis. Device location can help to identify fraudulent activities and protect users with an added layer of security.
Understanding footfall through big data sets is valuable for the financial sector. Mobile device data can help to forecast earnings, number of customers and other KPIs before they are formally reported. These insights help to inform investment decisions.
Real estate
Anyone looking to invest in real estate, or open up a new store branch can use location data to understand how busy certain areas are, what type of people you’ll see in certain areas and how well similar businesses in that area perform.
Government
The rise in mobile location data has provided better opportunities to understand how cities work. It’s helping to create systems and infrastructure that reflects this.
Combined with the increasing number of connected devices in cities, central planning authorities now have a set of tools that can inform decision making in many different areas.
Mobile location data is contributing to a better understanding of where demand for public infrastructure is most significant. For example, we could examine mobile device location data to understand the most cycled roads within a city. This information is precise and invaluable when planning where to implement new cycling routes.
The same is true of traffic and congestion. In increasingly crowded and polluted megacities, it’s crucial to understand how traffic issues can be alleviated. Understanding traffic flow and where to build new road structures or introduce new low emission zones is vital to making the kind of smart city that can sustain current levels of population growth.
Location data can have a substantial positive effect on this kind of planning. Thanks to the accuracy and uniqueness of mobile device data and location intelligence, it is changing how decisions are made in cities and towns around the world.
Verification
Transparency – why do we need it
As the amount of location data available to businesses increases, there is likely to be more bad data. Poor third-party data sets are becoming more frequent, with providers unable to validate the accuracy and precision of the data.
We’ve already discussed the need to for accuracy and precision in location data – the difference can mean a falsely attributed visit, irrelevant targeting or a negative impact on customer engagement.
The most accurate providers will be able to verify their first-party data sets. They can provide a detailed methodology around how they collect data. This is one of the main benefits of working with a provider that controls data collection – their data is first-party and therefore reliable and transparent.
Explainer: 1st, 2nd and 3rd party data
Third party data is data that is purchased from outside sources where the provider you are working with is not the direct collector of the data.
Second-party data is somebody else’s first-party data. This data comes from their first-party audience, the source is clear, and the provider usually demonstrates the accuracy and collection.
First party data is your data that is collected directly from your audience or customers.
Of course many businesses don’t collect first-party location data so they work with a location data company to source the data for their campaigns, or other business needs.
In this scenario, second party data is much more reliable than third-party data. You can understand how the data is collected as the methodology is transparent, and the data accuracy can be verified. Of course, this doesn’t confirm that the data is accurate – but at least you can check yourself if this is true.
The best providers can explain how they collect data, how they filter out inaccurate data and can usually provide a reliability score with data to allow the end-user to understand the data they are working with.
Privacy
2018 saw the introduction of GDPR in Europe. In the US, the upcoming CCPA act data privacy will still be front and center in the data community. We are quickly moving towards a world where each individual will have control over their data.
Businesses using location data will need to take a similar approach. It’s pivotal to allow the individual to take control of their data. Businesses must inform users of how their data is used. They must provide clear opt-in and opt-out solutions so that transparency can be placed at the center of the big data revolution.
Businesses that utilize location data will need to be clear about how they collect and use consumer data. Location data providers need to have a clear opt-in process that allows consumers to understand how their data is used.
Data providers should provide solutions at the point of collection, which allow them to manage consent preferences through to the point of data use.
As with the verification of accuracy, understanding data privacy is more accessible if your provider is working with first-party data.
For example, at Tamoco, we have built consent functionality into our SDK. This allows the publisher to collect user consent at the point of data collection in accordance with the IAB framework.
For the data user, this means that they can understand how consent was given, and for which purposes.
When choosing a location data provider to work with, there are many things to consider. With several different sources, signals, and methodologies available, it’s essential to understand exactly what each provider is offering.
We have put together the following list of questions that are useful when selecting a location data company.
Buying location data
So you have a valid use case for location data, how to do you go about purchasing location data?
We have put together this section to help you to understand what to look for when working with location data providers.
What does good location data look like?
As we mentioned earlier, it’s important to look out for a few things when buying location data you should look for the following attributes.
Quality
In terms of quality, you want location data to be accurate, and you want it to contain the attributes that you need to achieve your goals. In terms of accuracy, you should look out for a score in the data set. This will tell you how much you can trust a data point. It might make sense to filter out data that sits below a certain level of accuracy, depending on your project. Don’t be afraid of asking your location data provider if they can give you a trust or accuracy score.
Then you should look at the metadata. Most providers will provide more than a lat long. As a good rule of thumb here are the attributes that you can expect to find in a location data set:
Field
Description
Example
device_id
The advertisment id for the phone
6E82079C-8346-4DA5-BF5B-76214862F7DC
device_ip
IPv4 address
192.0. 2.146
event_ts
The timestamp of when the location observation was collected
2020-12-06 16:39:28.000 UTC
latitude
The north-south position of a point on the Earth’s surface. First part of the device location
30.27297
longitude
The east-west position of a point on the Earth’s surface. Second part of the device location
-97.731528
geohash
A 1.2km x 609.4m grid which the Latitude and Longitude falls under
9v6s0p
accuracy
The accuracy of the device in meters
10
region
ANSI standard two letter state code
TX
country
ISO 3166-1 alpha-2 country code
US
device_type
Device type
Phone
device_os
The type of operating system. iOS or Android
Android
device_make
Extracted from the phones user agent. Defines the device manufacturer
Samsung
device_model
The device model number.
SM-A300FU
app_id
A anonymized and internal identifier for a unique app supplier
2684758
Scale
When purchasing location data you need to ensure that the provider has sufficient scale in the country where you need the data. You should consider how large the country is and then ask how many unique devices are in the dataset. This ratio will give you a good idea of the provider’s coverage in that area.
Some projects (training AI) might require a higher level of coverage, whereas other use cases could be workable with less.
Ultimately different location data providers and companies will be better suited for different types of location data.
Here we’ve don’t the legwork for you and broken down the best location data providers for each data type.
Best provider of raw location data
Raw location data is location data or mobility data in its purest form. This data is often pseudonymized but you should check with your provider. The primary use cases here can be vast, but they can feature in a number of industries from automotive to finance and marketing.
At Tamoco they carefully curate personalised feeds or raw data. It’s powered by leading ML algorithms to filter out bad data and it’s fully filterable by region, time or another attribute. Best of all it’s delivered programmatically in a way that suits your project.
Best place to buy property data
Property data is used to augment raw data to provide an outline of buildings and or pieces of land that don’t show up on a classic map.
The primary use of these datasets is to asses building risk factors.
Best provider: SafeGraph.
Best place to buy visits data
Visits data is a form of mobility data that is used to identify how many times a device is seen in a particular location. This data uses a proprietary technique to attribute. raw location point to a POI.
The used for this are found in retail, finance and governance.
Mobility data is counts of people that visit a POI but they are generally anonymized and done on a higher level than a single POI. This kind of data will usually include timings such as average times of visits.
This data type is used for advertising, urban planning and insurance..
Tamoco provides extensive mobility data and is one of the leading mobility data companies that operate globally. Its smart tech allows datasets to be generated quickly based on fully custom requirements.
Where can you buy location data?
You can find location data in a number of places from marketplaces, and exchanges or by talking directly to location data companies. These companies will have a dedicated team of experts who can help you to understand the nuances of location data, mobility data or geospatial data.
How much does location data cost?
The cost of location data can vary hugely depending on your use case or the size of the dataset. Other factors that can affect the cost of location data are the region (some country’s data is worth more than others) or the quality.
Questions to ask a location data company
Place/POI
What is the source of this data?
How much of your POI data is 1st party vs. 3rd party?
How do you organize the geographical area around a POI or place?
Can you share how precise your POI/place data is?
How many POI locations do you have?
What metadata is associated with these places?
How do you verify your place database?
Device
How do you collect location data? Is this process first-party, or is the data 3rd party?
What type of device data do you use (GPS, wifi, beacon, etc.)?
Is your data sourced from an SDK?
Do you have a method in place to filter out data that isn’t relevant for my campaign or merely inaccurate?
what is the scale of your dataset?
Red flags
The number of Businesses in the location data space can make it hard to differentiate between them. Below are a few red flags that you should keep an eye on the next time you’re speaking to one of these companies.
All of our data is accurate to 5m
Some data providers will make big claims regarding how accurate their GPS derived data is. As mentioned earlier, GPS can be accurate within a 4.9 meter radius, and this can be further improved when combining with WiFi and Bluetooth signalling.
The truth of the matter though is that GPS accuracy will vary massively, possible reasons for this are:
Mobile devices lose and regain mobile reception as they move around
Buildings, bridges, trees and roofs can block and reflect GPS signals
The better data providers don’t just look at the accuracy of GPS signals. They will take additional data fields into account, such as looking at the motion type, speed, altitude etc of the device to determine the likelihood of a device visiting a store at a given point in time.
Accurately measuring how a device moves is a complex issue, and you should be wary of data companies giving simple answers with blanket statements.
Our visit data is correct because of our precise polygon geofences
Accurately mapping POI is important to try to understand whether a device actually spent time there. However, a lot of data providers out there will claim that the reason they’re able to attribute POI visits is because of the precise polygons they’ve been able to draw around POI.
As mentioned above, GPS accuracy has a high degree of variability. You can have a precise polygon geofence around a 20 square meter retail unit, however if all the signals you place inside the geofences have +/- 50 meter accuracy, you’re not doing a good job at understanding who spends time in that POI.
Want to learn more?
At Tamoco, we are always innovating in how we collect and use device location. We’ve spent years fine-tuning our methodology to correctly verify how a device moves and behaves in the real world.
What is location data?
Location data is geographical information about a specific device’s whereabouts associated to a time identifier. This device data is assumed to correlate to a person – a device identifier then acts as a pseudonym to separate the person’s identify from the insights generated from the data.
How accurate is location data?
Location data is only as accurate as the source. GPS is usually the most reliable but only outdoors. Usually a combination of Bluetooth, GPS and other signals will provide a more accurate reading of device location.
Is location data compatible with GDPR?
Yes. Businesses that utilize location data will need to be clear about how they collect and use consumer data. Location data providers need to have a clear opt-in process that allows consumers to understand how their data is used. Data providers should provide solutions at the point of collection, which allow them to manage consent preferences through to the point of data use.
What is location data used for?
Location data can be used to target, build audiences, measure and gain insights and understand the offline world.
Big data has become the power that organizations need to harness to move their company forward at high speed. By the year 2020, the amount of data available in the world is estimated to be roughly around 44 zettabytes. Collecting all these datapoints will do no good unless it is utilized through the proper channels.
Various organizations from across the world are harnessing big data to create better business models and execute faster development strategies. Big data is playing a pivotal role in reducing operational costs through statistical and predictive analysis. In Supply Chain Management (SCM) too, there is a lot of data available. When this data is put together to create meaningful operations, it can make the entire supply chain more feasible.
While some organizations have identified what big data could do for their supply chain systems, there are a lot of companies which are yet to explore the possibilities. Here are some of the most crucial aspects through which big data can help to groom the SCM.
Be on Top of Your Demand
Predictive analysis is a huge part of making use of big data. With a considerable amount of data at their disposal, companies can avoid inevitable redundancies in their operations all the while making efficient use of the stocks. There are a lot of ways through which the predictive analysis with big data can help.
Companies can identify retailers who may need some stock sooner and the retailers who take longer to complete the stock order. Companies can analyze their orders and see if the cost of supplying the stock to some regions may be too higher than what they could afford. Companies can even predict which of their loyal customers may switch to their competitors and which of their competitors’ customers are looking to explore other options.
Much can be gathered from the predictive analysis of these datasets and enable companies to take precautionary measures and be ready for any potential surprises.
One good example of a multinational company using big data for the supply chain is PepsiCo. Replenishing the stocks of retailers is of significant importance for a customer-oriented product supplier like PepsiCo. Therefore, they make use of big data to predict the retailers’ stocks based on the data of the inventory they have, the time needed for the shipment, and the volume required to be shipped. This has helped PepsiCo to ensure that their products are never out of stocks from their retailers’ and at the same time, ensure that there is no high wastage. This has also been applied to retail, where the demand of designer swimsuits is predicted to ensure delivery in peak times.
In short, the predictive analysis with big data for supply chain helps companies to make the right volume of stock available to the right people at the right time.
Be in Control of Your Operations
Even when the external factors seem to be out of control most of the time, with big data analysis, you can be in control of your supply chain operations.
One significant problem that many supply chain managers face is the problems they face on the journey between the moment the product leaves their warehouse to the time it reaches the retailers. This is where a lot of external obstructions can affect delivery. When the data for the entire supply chain operations is collected over several years and updated frequently, companies can avoid and find a roundabout better way to ensure that the supply chain is not affected by these out-of-hand disturbances.
Moreover, analysis of big data will also enable companies to find better supply chain routes that are optimal and profitable. Based on the demand, expected revenue, the geoanalytics, and available modes of transportation, the analysis can to create improved and efficient ways of managing the supply chain, reducing cost and decreasing delivery time.
Be on The Constant Path of Innovations
Innovation is a necessary part of the supply chain, and big data doesn’t just stop at helping supply chain manageability, they also provide new avenues for achieving better efficiency.
You can idetnify new delivery channels that could half the cost or merge existing delivery channels for better optimization. For an organization to improve, they have to be continually innovating, and big data plays a significant role in these innovations.
Accenture found that including big data in their supply chain operations led to a 2.6x times increase in their supply chain efficiency. This consists of the innovations in the SCM through multiple channels.
A good portion of getting the best out of a big data or analytics company for SCM is by innovating as the company progresses. These innovative ideas can also help the supply chain managers in decision-making, having better control, and minimizing their problems.
Leveraging the data available at hand prevents unexpected supply chain issues and streamlines supply chain operations. Companies can save a great deal of money, cut down the time spent on managing the supply chain, and further assisting in future expansions.
For real estate, there’s nothing more important than location Whether looking for a place to live or identifying the best place for commercial property – location is the most crucial factor.
Companies in the space are looking beyond simple location classifications like zip codes or areas. Instead, more robust modeling and new datasets have opened the door to understand how neighborhoods are changing and what the people who live in specific areas want from their location.
Let’s look at how data is innovating the in real estate space.
Data for real-estate investment
Evaluating and investing in new real estate opportunities requires extensive research and due diligence.
It pays to be the first to identify an up and coming area, but many companies have access to the same resources to try and understand where these hot neighborhoods are.
Emerging data sets, such as location are changing this. Movement data is giving real estate investment companies a head start, allowing them to understand the potential of a neighborhood before the competition.
Big data is allowing companies to answer the difficult question such as:
How to identify new neighborhoods or areas that are good prospects for investment
How to understand regional risks when investing
Location data is incredibly valuable in this area, not just because of the geographical nature of real-estate, but because the value of a property or area is determined by what happens in the surrounding area.
Real-estate value is closely linked to social and economic conditions – concepts that can be understood by using device location data. So the better your data, the better your insight into the investment potential of a specific region or area.
Utilizing location data alongside real estate demographic data and other third-party data sets allow real-estate to identify an investment opportunity early and measure and analyze the investment that you have already made.
Planning and development
For commercial real estate, the power of data is just as impactful as in the residential sector. Forget about costly to integrate footfall management systems. Location data can understand footfall across all real-estate properties, including your competitors. The most successful companies are using these real estate data analytics to adapt and plan in real-time.
Identify the most valuable spots
Location data can identify footfall in retail properties, both passing by and entering. Detailed metrics into visits and visit length can help understand the value of each location.
These insights can even lead to dynamic rent pricing or could also function as an add on product for tenants wanting to understand the benefits of their commercial property.
Increase operational efficiency
Real estate data can also help to improve operational efficiency. For commercial properties with vast amounts of footfall, such as airports, understand patterns around movement can significantly contribute to enhancing operations and optimized unused space.
These insights can be extended when developing new properties and planning from the initial placement of the project, to individual placement of retail booths inside. Predictive analytics in real estate is now commonplace and is having a huge effect on planning and development in the industry.
Advertising and marketing
Data isn’t just for planning and investment. Data has transformed the world of advertising and marketing, and this is true for the real estate industry.
Over 90% of home buyers start their search for a house online. Data is filling in the gaps between what the consumer wants and the ads that real estate delivers to these potential customers.
Datasets are making marketing and advertising more personal for these prospective customers. Ads can be targeted to those who have visited estate agents or personalized based on regular behavioral patterns. All allowing the real estate company to engage with a new audience in a personalized way.
This behavioral data can also be used to create a more engaging search process – where results are tailored to the user. This extends through to any consultation process, with the rise of chatbots, such as WhatsApp Chatbot and automation solutions requiring powerful data to be more productive.
Advertisers use audience segmentation so that they can eliminate any unnecessary spend from their marketing efforts, become more efficient and effective and boost key KPIs.
Using data, advertisers can create much smarter audience segments. They can prioritise the right consumer, with the right ad using the right message.
That’s why we’ve made sure that our precise, first-party data sets are available for marketers and advertisers to use directly in their DMP. Advertisers should be able to do this directly in their media buying solution.
About our data
At Tamoco we think that data accuracy is the most important thing for advertisers using data in their targeting, segmentation or attribution. That’s why we built a network that is leading the way in the drive towards more accurate data.
Proprietary location data focused on precision and accuracy
Tamoco’s data is industry leading. We use our proprietary SDK for data collection along with our extensive network of sensors to understand consumer location with higher levels of precision and accuracy.
Detailed visit behaviour
Tamoco’s data methodology is designed to reduce the number of incorrect data points. We understand visits with granular accuracy. False visits are filtered out, and our data methodology is transparent. This methodology means that advertisers can be confident that Tamoco visits data is more accurate than other visits-based targeting solution.
Benefits of using location directly in your DMP audience segmentation
To drive incremental gains to ROI location can signify which of these users are relevant to your campaigns. Location data is real-time and behavioural based. These attributes mean that you can exclude irrelevant audiences, and save valuable marketing dollars in the process.
Advertisers can then tailor their campaigns to users that have physically exhibited certain behaviours, such as visited a specific store or frequented a series of physical locations.
This targeting helps to build relevant messaging and ensures that your segments are squeaky clean in terms of precise targeting. No more wasted budget on consumers that aren’t relevant to your brand campaigns.
Location is a good indicator of intent
Add intent to the segmentation process. Retargeting campaigns are more effective if you can reach consumers when they are in the right frame of mind. Retargeting works well in the online world, but this is often limited to your current inventory.
Consumers show purchase intent in the offline world as well. Visiting your store is a good example. However, by mapping the offline world, advertisers can use location to identify consumer intent in different ways.
Retargeting to consumers who have visited (or are currently visiting) a competitor or a store in a similar category is a powerful way to reach the right audiences.
Using location data to fuel analytics
Using location signals directly in your data management platform enables smarter cross-selling. If you have built up a database of descriptive and behavioural audiences, adding location can provide a better way to upsell new products or promote return purchases.
Using your analytics solution, location data can directly increase how you understand consumer trends, patterns and intent. Location data is a tool for building up a more detailed view of your customers.
These insights can be used to inform future segmentation and predict which audiences are more likely to convert at a specific stage in the buyer journey.
Using location to build lookalike audiences
Reaching new customers that are currently outside of your customer data set can be challenging. It’s something hard to know if the process of building lookalike audiences is reliable.
Using location data, it’s possible to build real-world behavioural based audience segments. For example, by taking an audience that converts highly, we can understand similar consumers based on how they move and behave in the real world.
This generates lookalike segments that are based on current real-world behaviour rather than vague similar interest data. Ultimately it will build segments that are more likely to convert.
Example segments and audience segmentation strategies
Some of our location-based segments are available already. Here we will look at some familiar audiences segmentation use cases using this data.
Women’s clothing stores
Brands looking at segmenting their audiences based on consumer interests can use location to refine their audiences. Let’s look at how this would work with an audience based segment.
You already have a pre-built audience that is relevant to your women’s clothing brand.
Using location-based filters directly in your DMP you can further filter this audience to reach the most relevant users.
You can filter based on the number of visits to women’s clothing stores. You can set the time period for these visits.
This will segment your audience based on those that have physically visited a clothing store in your defined time period.
Drinking places (alcoholic)
Using location, you can build retargeting audiences in your DMP to maximise your ad budgets.
If you are looking to retarget consumers based on their behaviour, then location can help to define the right audience.
Set your audience to include those that have visited an alcoholic drinking place.
You can filter these visits based on past visits, or on specific dates or days of the week.
This can help you to build incredibly specific audiences – such as Friday night venue attendees.
Speciality food stores
As previously mentioned, location data can be helpful to build new lookalike audiences based on consumer behaviour. This method can help you to create unique lookalikes based on actual measured real-world behaviour.
We can build an audience based on visits to speciality food stores. Here we have our seed audiences that consists of consumers that we know have visited a health store at some point in our defined time period.
We can do one of two things here:
Move the identifiers into our current lookalike modelling solution. This will create a new audience based on a unique seed audience.
Use a location-based lookalike solution. This will use the audience to match with devices that have exhibited similar real-world behaviour.
All of the above segments are readily available in leading DMPs and other media buying solutions.
How to activate Tamoco’s precise location data
Our data is currently available through DoubleClick, AppNexus, AdForm. Here you can begin segmentation immediately using Tamoco’s location data.
We can activate these segments instantly in The Trade Desk, Adobe Marketing Cloud, Facebook Advertising, Sizmek, Beeswax, Widespace and BrightRoll. Please contact us to enable this.
Want something more custom?
We can build custom segments on demand with our team of data scientists. These can be fed into the above solutions. Here are some examples of what our team can provide for your campaigns.
Brand affinity – we can create segments that are based upon brand affinity to your brand, a competitor or another relevant brand.
Detailed visits – Our team can help segment audiences based on verified visits to any physical POI, venue or location.
All of our data solutions can be fed into your current data or targeting platform. Our team of data scientists are ready to support your integration and take your marketing to the next level.
We wait four years for a world cup to come around. The final is the most watched event in the world. That’s a whole lot of consumer interest – it’s one that businesses need to get right in order to maximise the effect of this once-every-four-year event.
The World Cup consists of 32 nations. IN the UK every game is broadcast on terrestrial TV. Globally around 3.4 billion people watch some part of the tournament. It’s a huge event for a number of industries, but none more than perhaps the beverage industry.
That’s why it’s important to understand consumer behaviour during these monumental global events. Understand how customers move and behave can help business perform well across a number of different functions, from advertising and marketing to insights and planning.
To identify alcohol and consumer trends during the World Cup we analysed visits to over 5000 venues across London during the 3-week tournament.
Our accurate first party data-set combined with our network of precise location sensors provides detailed insights into how consumers behaved during the World Cup. Our visit methodology provides a powerful way to reveal trends and behavioural information around consumers.
To keep up to date with the latest data trends, sign up to our monthly newsletter.
The finance industry is a highly competitive space. It faces a new generation of disrupting banks and regulations. It’s an industry that needs to utilise big data to drive personalisation, boost customer loyalty, security and fuel everyday investment decisions.
The financial services industry has always been at the forefront of technical innovation. The availability of new datasets has provided a powerful way to understand behaviour and offers new directions for the financial industry to be predictive.
Big data application in financial services goes beyond predicting share prices. New data types are revolutionising the space.
We’re going to break down some examples of how big data is being used in financial services.
Personalisation
Personalisation has long been a priority when dealing with consumers. This is true both inside the finance industry and across other verticals with a strong consumer presence.
Disruptor banks have begun to establish themselves in the finance sector. One thing that these banks have done well is personalisation.
By understanding users spending habits and behaviour, they can offer more personal spending products and recommendations.
For example, in the world of digital banking, if a bank had the right data sets around its customers, it could provide services that truly bring value to the end customer. If a bank understands what their customers spend, where they go and where they work they can, for example, suggest that a travel card could save them a lot of money each month.
It’s in these areas that financial services can learn from disruptor banks. With the right dataset, the banking experience can be personalised for customers. This will allow financial services to boost customer loyalty and drive cross-selling of their products much more effectively.
Security
There are few industries where security and fraud are more of a threat than in the financial services.
As technology has advanced those in the space must be smarter and better adapted to the fast-changing tactics of those looking for weak points in sometimes outdated systems.
Adding location intelligence to the equation adds an extra layer of security for customers and allows financial institutions to instantly provide checks based on where a customer uses its products.
Location offers a new way for security teams to identify fraud. Location data can help to educate security systems on customer behaviour and can form a strong base from which to detect irregularities in financial behaviour.
Financial services continually process an incredible number of transactions. A location overlay which includes operational rules can help to determine when to flag records as fraudulent.
These processes enable financial services to provide better safeguards to their consumers and clients.
Investment
The rise of big data carries enormous potential for investors. Many have implemented predictive systems that are designed to understand data sets, digest vast amounts of data and then inform investment decisions.
These data sets have proved successful, but accurate location data is rarely used to optimal effect in this area. Location intelligence provides a more detailed understanding of trends and ingesting these precise datasets can help investors to stay ahead of the competition.
Understanding how populations move and behave en mass is readily available in the online world. Location offers something slightly different. It helps to understand how consumers move in the offline world.
Using location allows minimal lag between an aggregated understanding of consumer trends and investors being able to forecast the performance of portfolios and financial markets.
This allows investors to act quickly and decisively. Location is a fantastic indicator of market, brand or individual behaviour. With the progress made in accuracy by some in the space, this will prove to be one of the next steps in predictive analytics for the financial sector.
Insurance
For insurance location underlies everything. Many insurers can immediately benefit from quality location data to better model risk and dramatically improve their underwriting and pricing.
In insurance, nearly every data point has a relation to location.
Crime data – understanding crime risk in specific locations including historical data and predictive solutions can provide significant advantages to insurers.
Catastrophe – using data analytics insurers can mitigate the risks involved with catastrophes based on a customer’s location.
Behavioural data – using new kinds of behavioural data, such as location, can allow insurers to understand consumer behaviour better. This helps to predict risk and assist with pricing.
These datasets are now available in large quantities. Precise location allows for more accurate insights and the ability to generate this data, as well as store and process it, has changed the game for the insurance industry.
New revenue
For financial businesses, consumer data also holds the key to new revenue. It allows companies to maximise revenue from existing channels.
For example, using precision data marketing financial companies can identify products and services that are a much closer match for specific customers. This provides more value for both customers and branded partners.
Understanding customers behaviour allows companies to understand which type of person is more valuable for their business.
Using this data, it’s possible to build lookalikes and use this to drive more targeted marketing activity to customers that represent a greater potential for higher revenue.