Categories
Attribution & Measurement

Why Last-Click Attribution Fails for Physical Retail

Last-click attribution gives all the credit for a conversion to the final thing someone clicked. For a purely digital funnel that is a defensible simplification. For a business whose revenue happens in a building, it is close to useless — and worse, it is systematically misleading in one direction.

What last-click actually credits

Last-click follows a chain of digital touchpoints and awards the conversion to whichever came last before the purchase. It is cheap, immediate and available in every analytics platform, which is why it became the default.

Its logic holds together only while every meaningful interaction is a click, and the conversion is a click too.

Where the chain breaks

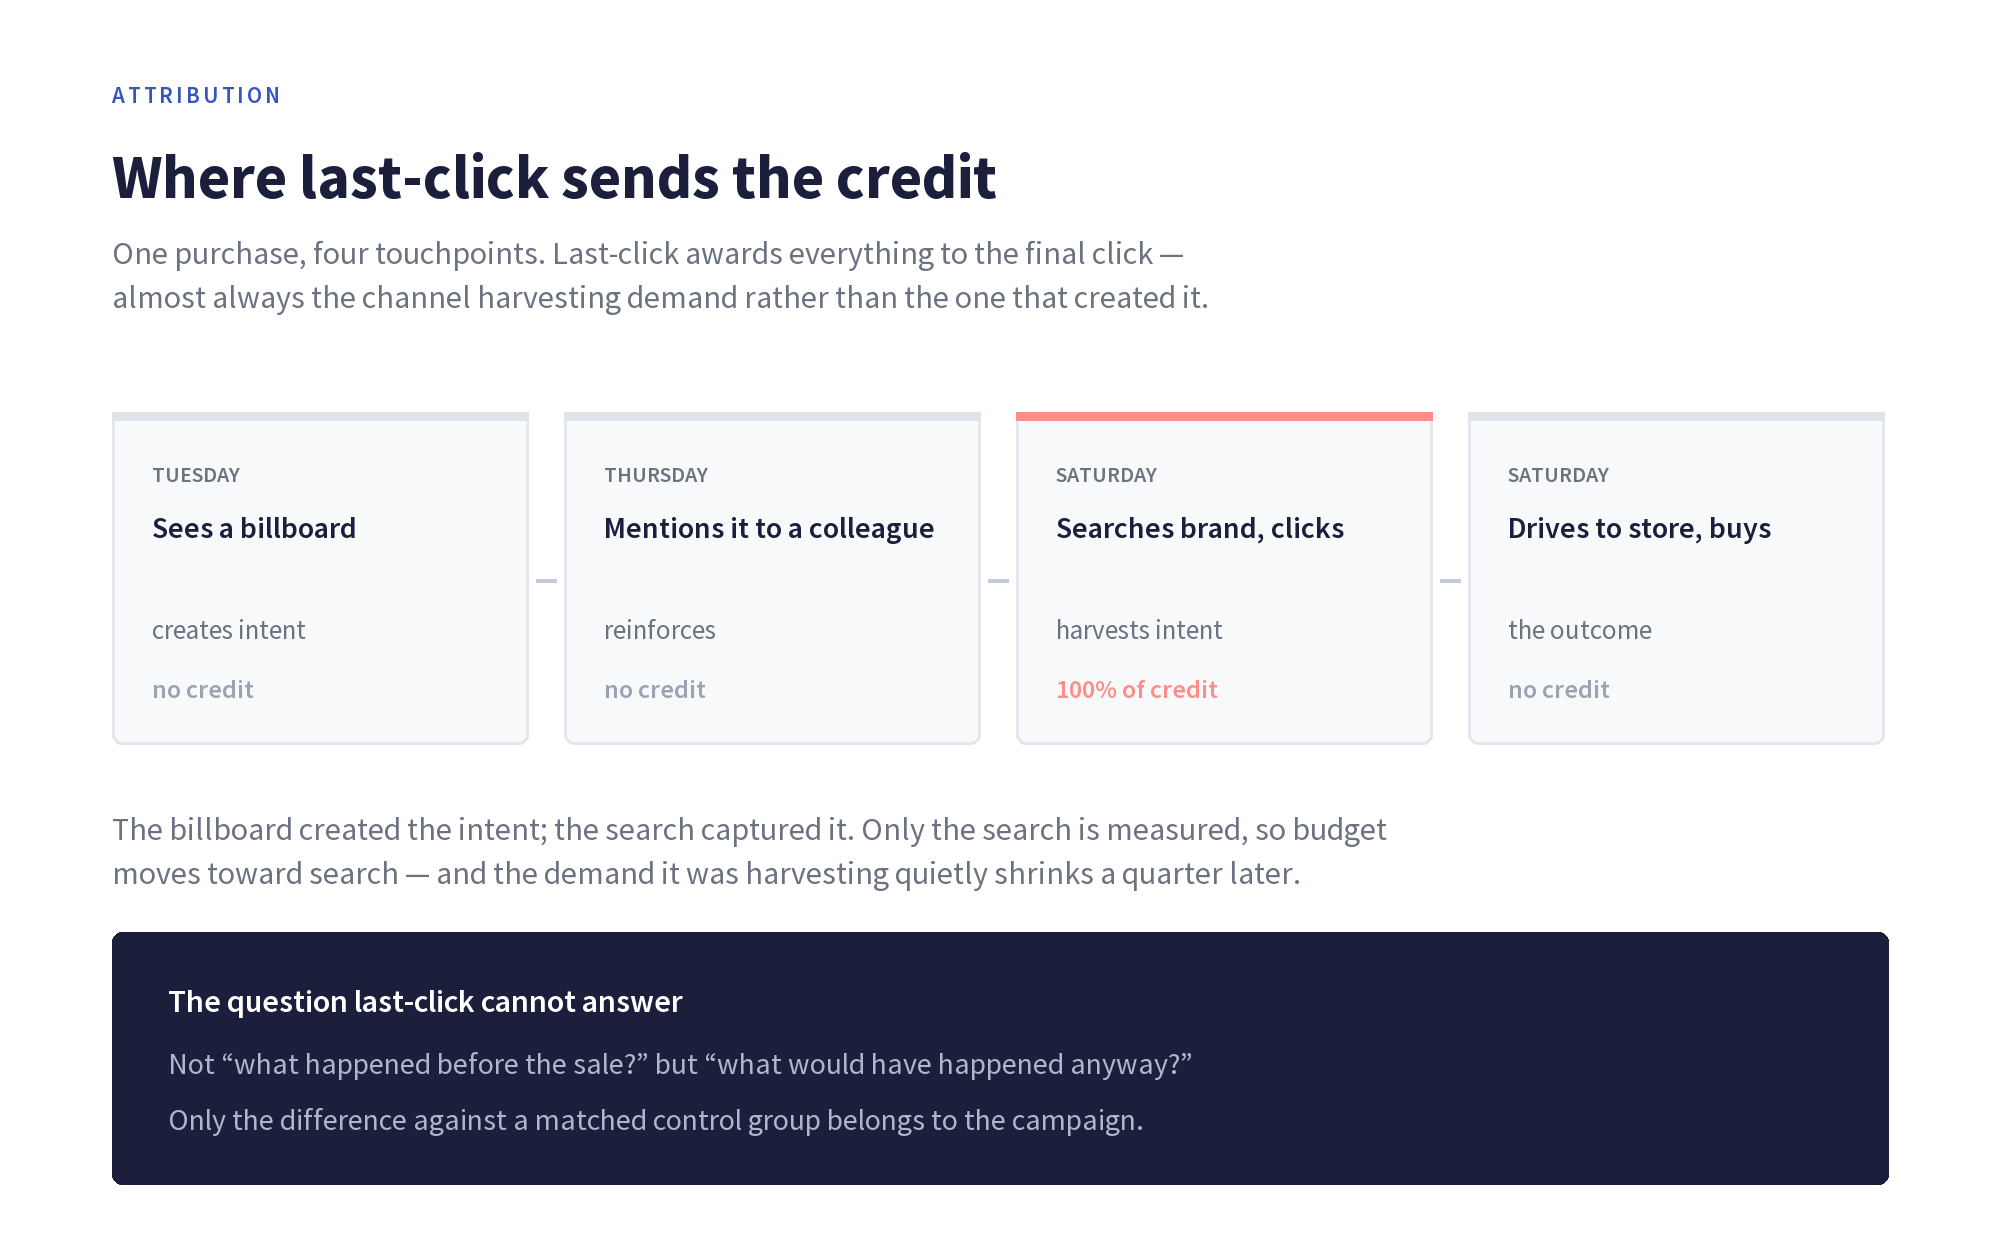
Consider a real sequence. Someone passes a billboard on Tuesday. On Thursday they mention the brand to a colleague. On Saturday they search the brand name, click the top result, and then drive to the store and buy something.

Last-click credits branded search. The billboard that created the intent gets nothing, because no click exists to record. Neither does the conversation. And the purchase itself — happening in a shop, in cash or on a card that analytics never sees — may not register at all.

The failure is not that last-click is imprecise. It is that the thing which caused the outcome is invisible to it by construction.

The structural bias this creates

This is the part that costs money. Last-click does not distribute error evenly; it consistently over-credits the bottom of the funnel.

Branded search sits closest to the conversion, so it collects the credit. Retargeting sits close too. Anything that builds awareness — out of home, radio, print, most social — sits further back and collects nothing.

Budget then follows the reporting. Spend moves toward the channels that appear to convert, which are mostly the channels harvesting demand that something else created. The demand-creating channels look inefficient, get cut, and the harvest shrinks a quarter or two later — by which point the cause is no longer obvious in the data.

Why this matters more for physical retail

For an ecommerce business, last-click is a flawed but functioning model, because the conversion is at least observable. For physical retail the conversion happens outside the measurable system entirely.

That means a retailer using last-click is not measuring a distorted version of the truth. It is measuring a different thing: the digital traffic that preceded a purchase it cannot see.

What to use instead

Approach What it answers Cost of running it
Visit attribution Did exposed people visit more than a matched control group? Low — needs quality location data and a proper control
Geo holdout testing What happens to sales in regions where we stop advertising? Medium — requires withholding spend somewhere
Marketing mix modelling How much does each channel contribute over time? High — needs long history and analyst capacity
Brand lift surveys Did recall and consideration move? Medium — measures attitude, not behaviour

None of these replaces last-click for the jobs it does well. They answer the question last-click cannot: whether the advertising caused anything to happen in the physical world.

The common thread is a control group

What separates all four from last-click is that they compare against a counterfactual. Last-click asks what happened before a conversion. A controlled measurement asks what would have happened anyway — and only the difference belongs to the campaign.

That difference is the only number worth putting in front of a finance director.

Common questions

Is last-click attribution always wrong?

No. For measuring the efficiency of demand-harvesting channels within a digital funnel, it is fast and adequate. It becomes wrong when used to judge channels whose effect is upstream of a click, or outcomes that happen offline.

What is the difference between last-click and multi-touch attribution?

Multi-touch spreads credit across several digital touchpoints rather than one. It is an improvement, but it shares the same blind spot: it can only see interactions that produced a trackable event, so offline exposure and offline conversion remain invisible.

How do you attribute out of home advertising?

Through exposure rather than clicks — identifying who was plausibly near the advert during its run and comparing their subsequent visit rate against a matched unexposed group. Our guide to out of home advertising covers the formats this applies to.

Can offline sales be connected to advertising at all?

Not deterministically for every transaction, and any vendor claiming otherwise is overselling. What can be measured reliably is the incremental change in visits between exposed and control groups, which is the basis of a causal claim rather than a correlational one.

Next steps

If most of your revenue is earned in physical locations, the attribution model in your analytics platform is not measuring most of your business. Our visit attribution and measurement pages set out how real-world outcomes can be measured against a control.


Categories
Attribution & Measurement

What Is Visit Attribution? How Location Data Proves Campaign Impact

Visit attribution answers a question digital advertising has always struggled with: did the people who saw an advert actually turn up? Not did they click, not did they search afterwards, but did they physically walk into a store, showroom, restaurant or venue.

For any business whose revenue happens in a physical location, that is the only conversion that matters. This guide covers what visit attribution is, how the measurement actually works, what data it requires, and where it commonly goes wrong.

What is visit attribution?

Visit attribution is the practice of connecting advertising exposure to real-world visits. It uses anonymised location data to establish whether people who were exposed to a campaign subsequently visited a relevant physical location, and whether they did so at a higher rate than comparable people who were not exposed.

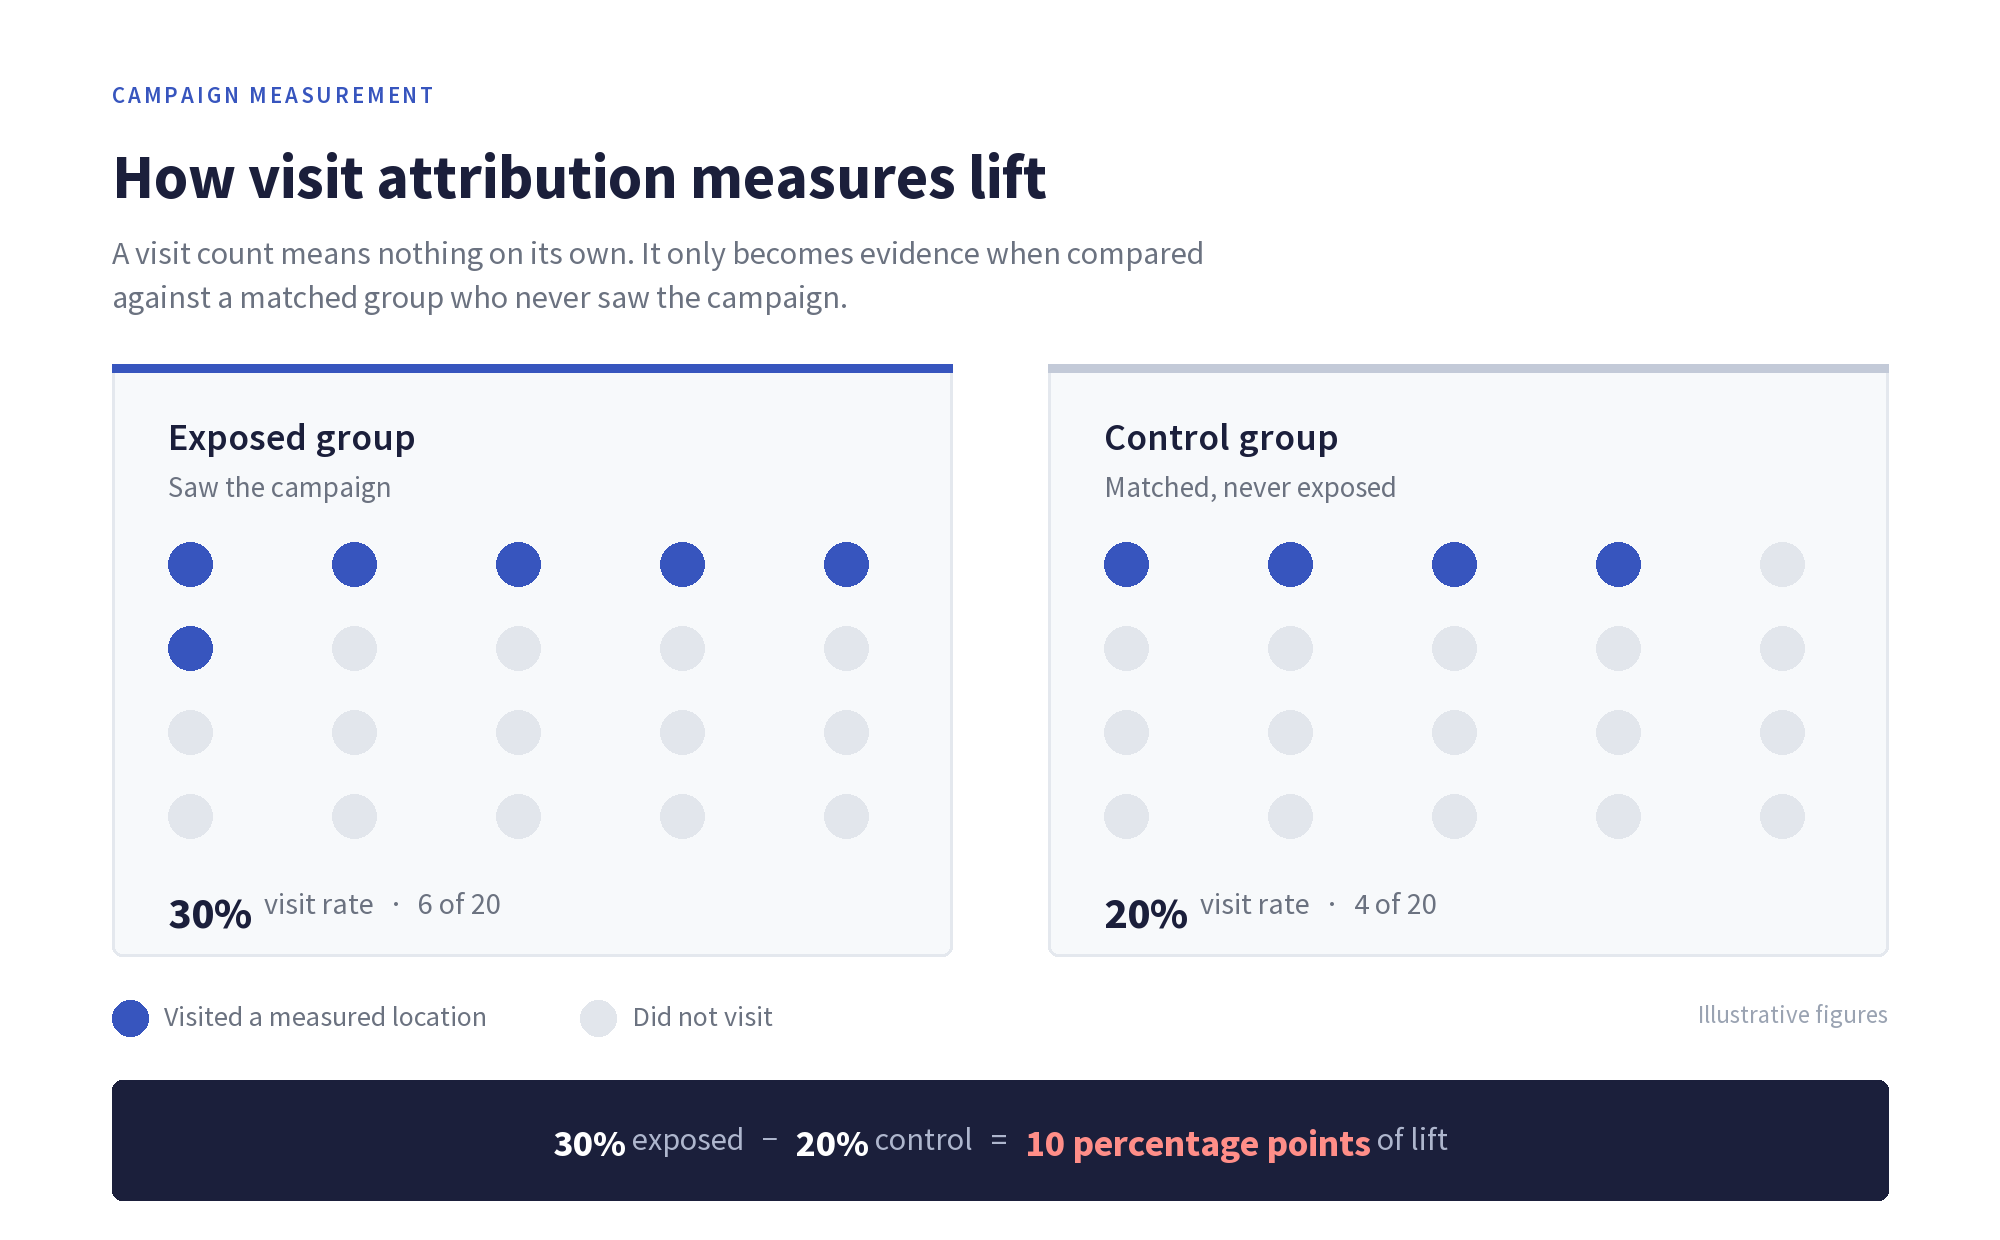
The output is not a count of visits. It is a comparison — the difference between an exposed group and a control group. That difference is the part the advertising can reasonably claim credit for.

Why click-based attribution fails for physical outcomes

Standard digital attribution follows a chain of clicks ending in an online action. That chain breaks the moment the conversion happens offline.

A shopper might see a billboard on Tuesday, think nothing of it, and visit the store on Saturday having never touched their phone in response. No click exists to attribute. Last-click models resolve this by crediting whatever digital touchpoint happened to come last — usually branded search — which systematically over-credits the bottom of the funnel and under-credits everything that created the intent in the first place.

For out of home, radio, print and much of social, this is not a small measurement gap. It is the whole picture.

How visit attribution works

The method is closer to a controlled experiment than to conventional ad tracking.

1. Define the exposed group

Identify anonymised devices that were plausibly exposed to the campaign — within range of a billboard during its run, or served a mobile impression. Exposure is probabilistic for physical media, and honest measurement treats it that way.

2. Define a control group

Identify a comparable unexposed group, matched on the characteristics that would otherwise explain a difference: location, movement patterns, time of day, device type. Without a matched control, any visit figure is meaningless — busy areas produce visits regardless of advertising.

3. Define the locations that count

Draw accurate boundaries around the places a visit could occur. This is harder than it sounds. A polygon that overlaps a neighbouring unit, a car park or a pavement will record visits that never happened.

4. Measure and compare

Compare visit rates between the two groups over a defined window. The difference is the lift attributable to the campaign.

Visit lift is the difference between the exposed and control groups, not the raw visit count.

Measurement approaches compared

Approach What it measures Strength Limitation
Last-click attribution Final digital touchpoint before an online action Cheap, immediate, universally available Cannot see offline outcomes at all
Estimated impressions How many people passed a site Simple planning metric Measures opportunity, not response
Survey-based brand lift Recall and stated intent Captures attitude, not just behaviour Self-reported; small samples; slow
Visit attribution Actual visits, exposed versus control Measures behaviour, works for offline media Needs quality location data and careful controls
Matched-panel testing Sales in test versus control regions Closest to revenue Expensive, slow, coarse geography

What the measurement requires

Visit attribution is only as good as the data underneath it, and three things determine whether the result means anything.

Positional accuracy. Consumer location data varies enormously in precision. Data accurate to within a few metres can distinguish one shop from its neighbour; data accurate to a hundred metres cannot, and will quietly attribute visits to the wrong business.

Panel scale and consistency. The exposed and control groups must both be large enough that the difference between them is a signal rather than noise, and the panel must be stable across the measurement window.

Consent and provenance. The data must be collected with valid consent and be traceable to its source. This is a compliance requirement, and it is also a quality signal — supply chains that cannot explain their provenance usually cannot explain their accuracy either. Our guide to data transparency and consented collection covers what to ask for.

Where visit attribution goes wrong

Claiming correlation as causation. Reporting raw visits from an exposed group without a control group produces a number that looks impressive and means nothing. People near a billboard were always going to visit nearby shops.

Sloppy location boundaries. Polygons drawn around a rough address rather than the actual premises are the most common source of inflated results, particularly in dense retail environments and shopping centres.

Measurement windows that flatter. A window long enough will capture visits that would have happened anyway. The window should reflect a realistic decision cycle for the category — same-day for convenience, weeks for considered purchases.

Ignoring seasonality. A campaign running into a peak trading period will show lift that the calendar, not the creative, produced. Controls need to account for it.

Visit attribution: common questions

What is visit attribution in advertising?

Visit attribution is a measurement method that connects advertising exposure to physical visits, using anonymised location data to compare visit rates between people exposed to a campaign and a matched group who were not.

How is a store visit actually detected?

By comparing anonymised device location against a defined boundary for the location, applying a dwell-time threshold so that passers-by are not counted as visitors. The threshold matters: a few seconds indicates someone walking past, while several minutes indicates a genuine visit.

Can out of home advertising be attributed this way?

Yes, and it is one of the main reasons the channel has become measurable. Exposure is inferred from presence near the advert during its run rather than from a click. Our guide to out of home advertising covers the formats this applies to.

What is visit lift?

Visit lift is the difference in visit rate between the exposed and control groups, usually expressed as a percentage increase. It isolates the campaign’s contribution from visits that would have occurred anyway.

How long after a campaign should visits be measured?

It depends on the purchase cycle. Convenience and food categories tend to use short windows of a day or two; considered purchases such as furniture or vehicles need weeks. The window should be set before the campaign runs, not chosen afterwards to suit the result.

Next steps

Visit attribution turns offline advertising from an act of faith into something measurable — but only when the underlying location data is accurate, consented and matched against a proper control.

If you are evaluating measurement for a real-world campaign, our visit attribution and measurement product pages set out how Tamoco approaches each of the requirements above, and our guide to location data explains the data types involved.

Categories
Attribution & Measurement

Everything You Need To Know About Attribution

Marketers now have a bigger arsenal than ever before. It’s a digital arsenal, an outdoor advertising arsenal, a location-based, personalized, tailor-made arsenal of marketing channels that attract customers.

All this power comes with a problem; it’s hard to tell which marketing channels have the most significant impact on your business. Creating dozens of campaigns across several channels might get the word out about your business, but you’ve got to tie leads back to the marketing channel that delivered them if you want to know what’s working.

That’s where marketing attribution comes in. Attribution means tracking each touchpoint customers have with your brand and assigning credits to those touchpoints according to how much they impacted the customer decision. According to data from HubSpot, companies that use attribution to show marketing ROI have a 12% bigger marketing budget than those that don’t.

Without attribution, you won’t know how to adjust spend and allocate resources towards the most effective, efficient marketing channels. Let’s make sure that doesn’t happen.


The Issue of Offline Attribution

Attribution can solve the problem of how to give credit to offline conversions. Imagine that someone calls your business’s call center after seeing your billboard, bus stop ad, or brochure. How do you assign credit to that marketing source if you can’t track a click?

Call tracking numbers can solve this issue. Simply put a tracking number on the ad, link it to your real number, and use call tracking software to capture that lead and track it back to the marketing source.

Offline attribution methods like call tracking allow you to quantify revenue from non-digital ads. As for the digital ads? Many tracking tools use first-click attribution; when credit goes to the first click that brings a user to a website.


A Simple Guide to First-Click Attribution

Picture this; someone performs a Google search for “what is CRM software.” That user finds your site in the search results and clicks. They visit your site, see your number and eventually call your salespeople. This is a lead, and the credit for this lead goes to the first marketing source they clicked on; Google organic search results.

Now let’s imagine something different happened. Instead of calling your sales team, that user ended up leaving your site without making contact. A few days later, they saw one of your PPC ads while searching for CRM software again. Recognizing your company name, they clicked the ad, called the tracking number on the landing page, and got in touch with a salesperson.

The credit for this lead still goes to Google Organic because that was the first click this user made before interacting with your site. There’s a problem though; PPC marketing also played an essential role in converting this customer.

Without the ability to track and account for all your marketing sources, you’d risk overvaluing Google Organic and undervaluing the PPC campaign simply because first-click attribution didn’t split the credit evenly between the two marketing sources. Marketers have recognized the need for more data and multi-channel attribution; a 2016 study found that 39% of marketers planned to use six or more marketing channels over the next two years.


Expanding Attribution with Better Data

Landing Page reports and Lead Page Reports give you the extra insights you need to assign lead credit across all marketing sources accurately. Landing Page reports tell you which web page the lead first landed on when coming to your site, a tidbit that can help you identify the keyword they used to search for your product. For instance, if they land on a specific product page, they likely used a keyword related to that product.

Landing Page reports can also reveal the other marketing methods leads used to visit your site. You may be sending out emails with links to pages on your website, or you may have backlinks from other sites, and landing page reports can reveal whether or not the people who clicked on those links ended up converting.

Lead Page Reports are a little different. They reveal which page the lead was on when they took a conversion action (calling, filling out a form, or initiating a chat). These reports reveal how effective various web pages are at turning prospects into leads.

First-touch attribution may only reveal one marketing channel’s effectiveness, but combining attribution data with a landing page and lead page reports will reveal how the various marketing channels intersect and impact the customer journey. In fact, you can even bring location data into the mix.


Realizing the Power of Real World Store Attribution

Attribution isn’t just for digital businesses. Integrating a real-world store attribution tool into your marketing stack will tell you when leads saw your marketing, when they came into your business and when they made a purchase. For brick and mortar businesses, this is a must. It’s also no longer a futuristic technology reserved for a select few; real-world store attribution tools are available.

With these tools, you can see how to drive traffic to your Shopify store, as well as your real0world store. You can see how long people stay in your stores, how often they visit, and demographic information about each customer. Maybe some marketing efforts drive people to your stores, but those people don’t make large purchases. You might be able to identify the marketing efforts that drive high-value customers to your stores, who make large purchases and come back for more.

The prevalence of mobile devices among the population has made real-world store attribution possible. However, these devices are just one part of the multi-device ecosystem that marketers must follow to capture every lead and trace it back to the marketing source.


The Need for Cross-Device Attribution

According to this Google research project, 51% of consumers will search for products across multiple devices, and 48% will directly navigate to their destination website from a different device than they used to find the site initially. Someone might search for a new CRM software on their phone, find a product they like, and then use their desktop computer to navigate that website directly and buy the product. Attribution has to be able to keep up with these changes.

That’s a lot of information to keep track of. Luckily for us marketers, that study was conducted in 2012, and attribution technology has caught up since then. While most consumers probably use multiple devices to shop even more frequently in 2020, it’s easier to track all searching, browsing, and shopping with cross-device attribution tools.


A Wrap-up on Attribution

Attribution is one of those marketing phrases that gets thrown around a lot, but it boils down to how well you can understand what marketing works. It’s the process of capturing data, tying it all together, and creating simple reports that explain what’s going on. If you can do that, you can calculate the exact impact your marketing has on the business’ bottom line. That’s valuable information, and it can make you, as a marketer, invaluable to your company.

Categories
Attribution & Measurement

What Metrics to Measure to Boost Your ROI

71% of B2B marketers calculated ROI, whereas 48% of B2B organizations needed more time to estimate performance. ROI is tricky to gauge relative to what marketers want to attain with the marketing strategy. Nevertheless, most marketers don’t rate the ROI of their efforts. Maybe you ran a campaign for a company and earned a big fat check.

What shows your efforts were successful for your hirer? Is it only an increase in their productive views on social media or increased web traffic? Measuring the success of a campaign based on one metric isn’t foolproof. Prove your worth with hard, concrete data to back your professionalism. It’s like paying for a write my essay custom writing service – you’re not buying just words on a page, but investing in expertise and research.

1. Set Clear Goals 

The main key metric to measure the success or failure of your marketing ROI is setting clear goals. Goals form the cornerstone of your overall strategy. It sets the direction for what needs to happen for a product or service to do well in the market.

Without these goals, it’s hard to determine the success or failure of your strategies. We highly recommend setting clear goals that help teams clarify objectives, identify areas of improvement, and create successful campaigns.

Here are examples of goals to start streamlining your efforts:

  • SMART Goals

SMART goals consider the vision, mission, and values, ensuring alignment and coherence with the long-term commitments of a marketing campaign. Specific goals iron out strategies, while measurable goals allow tracking progress and determining success.

Ensure that achievable goals are realistic and attainable to be successful. Relevant goals include acquiring new customers, establishing industry authority, or increasing web traffic. Lastly, time-bound goals set a specific deadline or timeline for a certain structure and urgency.

  • Actionable Steps

The next step is setting actionable steps that help define all your campaigns and related activities and set budgets, timeframes, and expected timeframes. Each step should clearly define and add to your strategy’s overarching objective. Also, it contains the exact details of your action plan.

  • Regular Review

Sometimes, it’s recommended to regularly review your current position to regulate what’s working and what’s not. If one part of your marketing strategy isn’t meeting the expected goals, you can rework it as part of the review process while making informed decisions.

  • Updating Goals

You must re-strategize your plans to help you grow your knowledge and skills. Understanding which techniques work better than others for the desired outcomes is easier. Ensure you’re flexible and adjust objectives to stay ahead of the competition and capitalize on new opportunities.

2. Track Web Metrics

Web analytics help you monitor progress, identify areas of improvement, and make informed decisions. It is a framework for evaluating performance and aligning actions with strategic goals.

Moreover, you understand user behavior-related metrics such as most visited pages, time spent on a page by users, most popular actions on a page, and engagement. Popular metrics include bounce rate, views, social referrals, pages per session, traffic sources, and new visitor sessions.

Leverage the power of tools like Google Analytics or BMIS to track key metrics and receive comprehensive reports to aid in making data-driven decisions.

  • Bounce rate

It refers to the percentage of sessions users didn’t engage in. It measures the number of users who visited your page but didn’t perform any action. Maybe they didn’t read any content posted, click a menu, or hit an internal link. It helps measure and analyze user engagement and understand how users use individual pages on your site.

  • Conversion rate

It computes the percentage of sessions where visitors have performed an intended action. This can include a product search, checkouts, signups, subscribing to a newsletter, or browsing and filling out a form. These stats evaluate specific elements of your platform, such as driving conversions and achieving set goals. You’d better comprehend the performance of your web pages or apps.

  • How long do people stay

This assesses the time visitors typically spend on your website in one visit. It helps you comprehend if people find your content interesting or useful. You can track which parts of your site grab people’s attention and keep them around. It’s a great way to spot what’s working well and what might need improvement regarding how customers ordeal your products or services.

Checking Social Media Execution

Social media can connect your business with your target audience, facilitate engagement, increase visibility, and offer valuable data for making informed decisions.

Talking to your consumers on social media helps you get closer to them and makes them more likely to stick with your brand. Many businesses find this approach costs less than old-school advertising. That’s why newer or smaller companies often prefer social media to connect with people.

Consumers become more receptive to your message when marketing through channels like Facebook, Instagram, or TikTok. These channels have millions of active users willing to engage with your content in a fun and easy manner.

  • Engagement rate

This measures the average of how much your followers respond to your social media posts. When lots of people interact with your content, it’s a good sign that they like what you’re sharing. You can track simple things like how many people leave comments, click the like button, pass your posts along to others, or mention you in their own posts.

  • Reach

It refers to the number of regulars seeing your content material. This facilitates you in realizing your current audience and the potential customers your marketing campaign might entice. You can easily track those numbers on diverse social media platforms. For example, META provides a ‘Reach’ metric below the ‘Insights’ tab. On LinkedIn, you can find it in your business profile’s ‘Analytics’ segment, even as X displays view counts after the analytics for every put up in your timeline.

  • Follower growth

How many new subscribers did your social media account obtain in a specific time? The quantity of followers you have affects how many humans see your posts proper off the bat and indicates marketing campaign success. Because maximum campaigns have a particular beginning and ending duration, tracking your follower increase throughout the campaign is important in assisting you in deciding how effective it is.

Key Takeaway

There’s a fine line between the success and failure of a marketing campaign, while key measures aren’t estimated. These metrics provide an insider look at your capability clients to understand their habits and behaviors to know which channels to use to touch them and message them to optimistically turn them into paying clients.

Related: read more about how visit attribution and campaign measurement work.

Categories
Attribution & Measurement

Cross-Device Attribution, Location & The Customer Journey

Marketing attribution has always been a tough area for marketers and advertisers. Attribution modelling has undoubtedly provided huge value. However, the ability to measure the effect of channels (or touchpoints) on the customer journey has often been fraught with difficulties.

Return on investment has been difficult for a variety of reasons. Understanding the entire customer journey has been problematic. This is especially true in the physical, offline world. Some offline marketing channels have also not been trackable. Attribution solutions have struggled with the multi-channel and real-time aspects that are crucial to understanding the full marketing picture.

Location intelligence has grown in terms of accuracy and scalability. This presents an opportunity. Some of the problems with attribution modelling can be solved with the application of accurate location data. Could this be the solution to the problems that limited marketing attribution in the past?


What is marketing attribution?

To understand the problems and the effect that location data can have it’s important to understand marketing attribution.

Attribution is the practice of allocating purchase revenue to the marketing touch points of a customer. In other worlds – understanding the effect of marketing efforts and channels on the purchase decision of customers.

Touchpoints can cover a wide range of customer interactions. Understanding the effect of these on sales or other valuable metrics allows for the optimisation of marketing channels, activity and budget.


What is offline location-based attribution?

Location-based attribution is the use of accurate mobile device data to fill in the gaps in traditional attribution models.

Smartphone adoption has grown rapidly. Understanding the where and how people move becomes scalable and precise. Customers rarely move without their mobile device, and this is the key. Higher levels of attribution precision are possible. Connecting the online and offline worlds becomes easier. Customer journey mapping and various touch point measurement is improved.

Until recently it has been impossible to understand the offline world. This has meant that advertisers have often been unable to attribute sales in physical stores and locations to a specific channel.

As smartphone adoption has grown using a device location has proved extremely useful in connecting the two.

Mapping the customer journey – cross device attribution

Basic attribution models have chosen to measure first touch or last touch. Much has been written about the failings of each. The choice lies in ignoring either early, top of funnel activity. Or failing to consider later, bottom of funnel activity that helps to move the customer along the buyer journey.

So the natural next step is to focus on multi-touch attribution. Focusing on touchpoints throughout the customer journey is important. But it requires accurate measurement across channels to be effective. The problem is that multi-touch attribution models don’t always incorporate what is happening in the offline world.

Location data allows a complete understanding of the customer journey. This means that it becomes possible for businesses to say the sort of thing like – okay this person saw our Facebook ad and has now completed a purchase. Previous attribution models would then attribute this purchase to the Facebook ad and not demonstrate how to generate leads on Facebook. But a more holistic view of the individual customer might point out that actually, the customer had visited the physical store previously.

This ability to model attribution across the online and the offline leads to a clearer picture of attribution. It allows brands to be better informed about the effect digital has on physical and vice-versa. Your customers exist across multiple marketing channels, so your attribution should too.

Previously brands have tried to close this gap by using various methods to map the offline customer journey. This usually took the form of a promotional code, which allows the brand to understand which channel had the desired effect. But whilst the picture is slightly clearer, it is not enough to be able to inform marketing budgets. Or to provide a clear understanding of the customer journey and the customer experience.

Only location intelligence can provide these insights. And it can do this across the online and offline world with a sufficient level of detail. Location data is versatile, quick and accurate. This makes it the perfect tool to help close the offline to online attribution loop.

Location data connect online advertising to the offline world. This allows for attribution in physical locations. This allows brands to measure store visits and link this offline activity to other digital touch points. It allows for more accurate customer journey mapping. This data can even be used to understand external offline touch points, such as OOH advertising. Already a complete picture becomes available.

Attribution has always had its problems. But brands and marketers should understand and implement insights from customer data points. In this way, location data provides a better understanding of the offline world. It allows brands to measure touch points more accurately. It allows them to map the customer journey in greater detail. And most of all, it allows them to measure the effects of cross-channel marketing in detail.

[mkdf_separator class_name=”” type=”normal” position=”center” color=”#E8E8E8″ border_style=”solid” width=”100%” thickness=”3px” top_margin=”50px” bottom_margin=”20px”]

Discover location based marketing

[mkdf_button size=”” type=”” text=”Get started” custom_class=”” icon_pack=”font_awesome” fa_icon=”” link=”/solutions-advertising-marketing/” target=”_self” color=”” hover_color=”” background_color=”” hover_background_color=”” border_color=”” hover_border_color=”” font_size=”” font_weight=”” margin=””]
[mkdf_separator class_name=”” type=”normal” position=”center” color=”#E8E8E8″ border_style=”solid” width=”100%” thickness=”3px” top_margin=”20px” bottom_margin=”0px”]

Related: read more about how visit attribution and campaign measurement work.

Categories
Attribution & Measurement

Retail Marketing Attribution Using Mobile Devices

What is mobile marketing attribution and what does it look like for retail?

Attribution is a term that is thrown around quite a lot at the moment in retail marketing. If your business is investing in mobile, then it’s time to understand what it means, and how it can help you.


But what does it actually mean? What can it do for your mobile strategy?

Attribution is the ability to measure marketing efforts. It’s about uncovering the inner workings of your marketing strategy and using this information to optimise, adapt and provide a great ROI.


What does this have to do with proximity marketing?

Proximity marketing uses attribution. This means that it’s possible to measure marketing efforts and directly attribute marketing decisions to events in the offline world. These can be store visits, for example.

This is extremely accurate and based on location. Not only can proximity provide attribution in the offline world, it does this with incredible accuracy. Using Bluetooth beacons and Wi-Fi hotspots it’s possible to pinpoint a consumer’s location with an accuracy of 1 meter. That’s incredibly useful for measuring attribution around individual products.

These insights are actionable for retail mobile marketers. More on this coming up, but armed with this information, retail brands can understand their ROI better, optimise budgets and create more engaging campaigns in the future.


Why is it useful in mobile marketing?

Attribution provides a clearer view of the customer journey. By measuring customers visits to specific areas of stores it’s possible to create a better image of how consumers interact with your store or product. By visualising your customer’s journey, you can gain insights into customer pain points and develop your marketing efforts to adapt to these. For example, you might realise that your OOH audience is visiting a competitor after seeing your advert. This is offline attribution and is only measurable through proximity technology.

This attribution also provides a better understanding of marketing spend. Get more specific information on your return on investment. You’ll be able to see exactly where your budget is most effective by assigning a value to individual mobile adverts or physical advertising. Your digital marketing is now measurable.

Understand the customer better in many previously unknowable locations. You can now see the customer journey from advert (physical, digital or mobile) to end goal. Know the exact number of store visits that your proximity marketing campaign caused, for example.

Create an intelligent mobile marketing strategy. Attribution allows for marketers to adapt mobile campaigns in real-time based on data that extends beyond clicks or site visits. If more people visit your store after seeing specific notification copy, then you can act on this information.

Find out how mobile marketing attribution can positively affect your brand’s retail marketing.

[mkdf_separator class_name=”” type=”normal” position=”center” color=”#E8E8E8″ border_style=”solid” width=”100%” thickness=”3px” top_margin=”50px” bottom_margin=”20px”]

Discover location based marketing

[mkdf_button size=”” type=”” text=”Get started” custom_class=”” icon_pack=”font_awesome” fa_icon=”” link=”/solutions-advertising-marketing/” target=”_self” color=”” hover_color=”” background_color=”” hover_background_color=”” border_color=”” hover_border_color=”” font_size=”” font_weight=”” margin=””]
 
[mkdf_separator class_name=”” type=”normal” position=”center” color=”#E8E8E8″ border_style=”solid” width=”100%” thickness=”3px” top_margin=”20px” bottom_margin=”0px”]

Related: read more about how visit attribution and campaign measurement work.