Categories
Privacy & Consent

Consented Location Data: What Consent Actually Requires

Almost every location data vendor says their data is consented. Very few can show what that consent actually covered, who obtained it, or what happens when someone withdraws it. Those are different claims, and only the second one survives diligence.

What consent has to be under GDPR

The GDPR sets a specific bar. Consent must be:

  • Freely given — not a condition of using an app that has no need for location.
  • Specific — covering a named purpose, not bundled into a general permission.
  • Informed — the person understands what is collected and who receives it.
  • Unambiguous — a clear affirmative action, never a pre-ticked box or silence.
  • Withdrawable — as easily as it was given.

An OS-level location permission is not, on its own, consent for commercial data sharing. It grants the app access. Whether the person agreed that their movements could be collected, aggregated and sold is a separate question, and it is the one that matters.

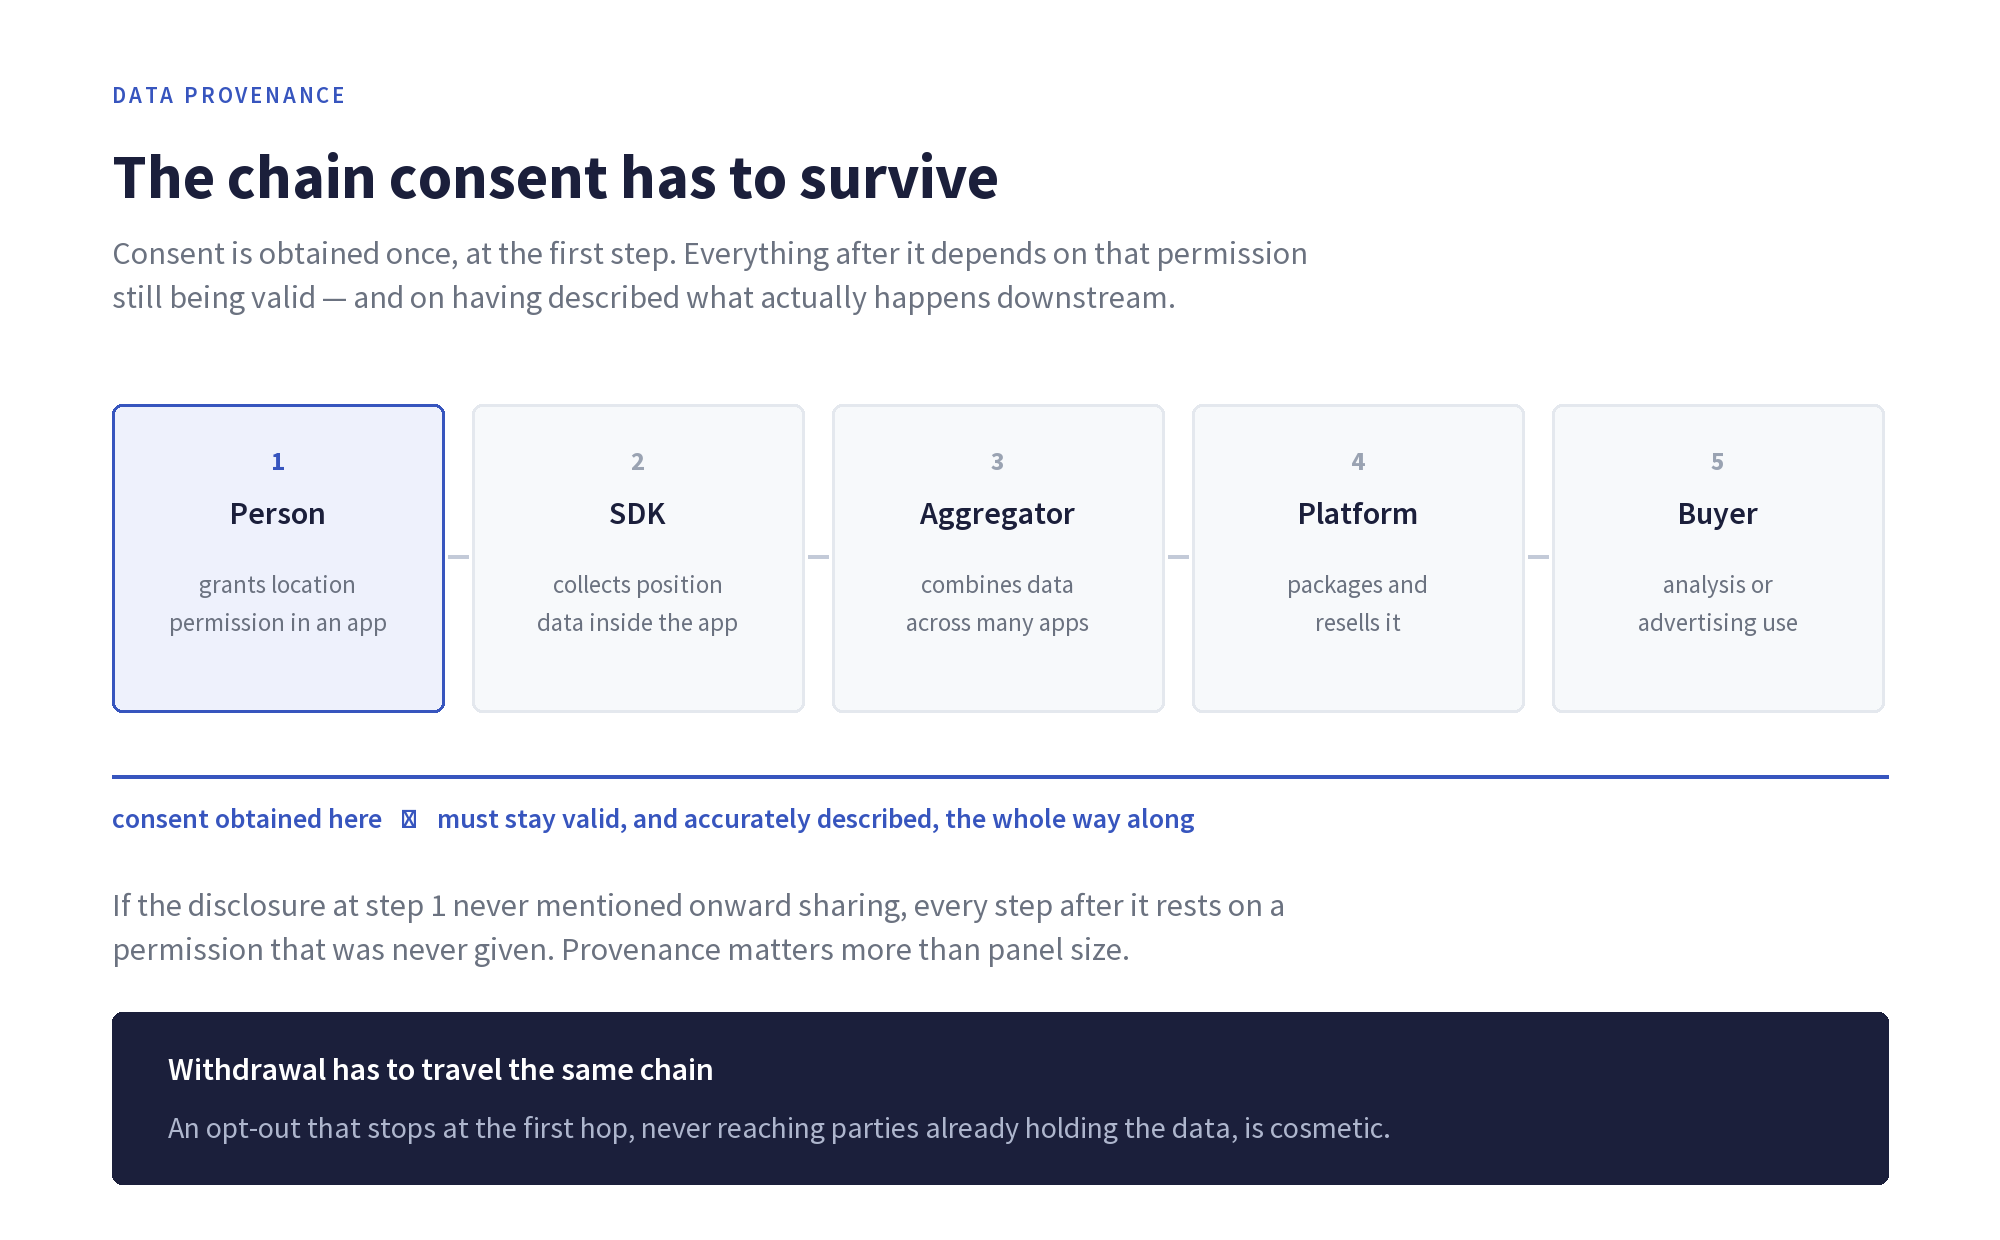
The chain consent has to survive

Location data typically passes through several hands between the person and the buyer:

  1. A person installs an app and grants location permission.
  2. An SDK inside that app collects position data.
  3. The SDK operator aggregates data across many apps.
  4. A platform or broker packages it.
  5. A buyer uses it for analysis or advertising.

Consent is obtained at step one. Every later step relies on it remaining valid and accurately described. If the disclosure at step one never mentioned onward sharing, everything downstream is built on a permission that was never given.

This is why provenance matters more than volume. A large panel assembled from sources that cannot evidence their consent is a liability, not an asset.

What to ask a supplier

Question What a good answer looks like
Where does the data originate? Named SDK or first-party sources, not “a network of partners”
What were people actually told? The disclosure wording, not a summary of it
How is withdrawal propagated? A described mechanism reaching downstream recipients, with a timeframe
Are consent records auditable? Evidence per source, retrievable on request
How are opt-outs honoured? Handling of platform signals and direct requests
What happens on a deletion request? A working process, tested, not a policy page

Where it usually goes wrong

Consent for one purpose reused for another. Permission for maps inside a navigation app does not extend to selling movement patterns to advertisers.

Withdrawal that stops at the first hop. If someone opts out and that signal never reaches the parties already holding their data, the withdrawal is cosmetic.

Provenance that dissolves under questioning. A supplier who cannot name their sources cannot evidence consent for them either.

Treating anonymisation as a cure. Location histories are famously re-identifiable; a handful of visit patterns can single out an individual. Removing an identifier does not automatically place the data outside GDPR.

Why this is a data quality issue, not only a legal one

It is tempting to file consent under compliance and move on. In practice the two track together. A supply chain that can explain its provenance can usually also explain its accuracy, its panel composition and its refresh rate. One that cannot evidence consent generally cannot evidence methodology either, because both require knowing where the data came from.

Diligence on consent is, in effect, free diligence on quality.

Common questions

Is location data personal data?

Usually yes. A position history singles out an individual even without a name attached, because it reveals where someone lives, works and spends time. Regulators have consistently treated it as identifying.

Does an app permission count as consent?

Not by itself. It grants the app technical access. GDPR-valid consent for onward commercial use requires a specific, informed and unambiguous agreement to that use.

What is the difference between consented and anonymised data?

They address different things. Consent concerns whether collection and use were permitted. Anonymisation concerns whether an individual can still be identified. Anonymising data does not retrospectively supply consent that was never obtained.

Who is liable if a supplier’s consent is invalid?

Under GDPR, controllers carry responsibility for the lawfulness of the data they process — including data acquired from third parties. Buying from a supplier does not transfer that obligation, which is why diligence sits with the buyer.

Next steps

Consent is not a checkbox in a procurement form. It is a property of a supply chain, and it can be evidenced or it cannot.

Our data transparency pages set out how Tamoco sources consented location data and what we can evidence about it.

Categories
Attribution & Measurement

Why Last-Click Attribution Fails for Physical Retail

Last-click attribution gives all the credit for a conversion to the final thing someone clicked. For a purely digital funnel that is a defensible simplification. For a business whose revenue happens in a building, it is close to useless — and worse, it is systematically misleading in one direction.

What last-click actually credits

Last-click follows a chain of digital touchpoints and awards the conversion to whichever came last before the purchase. It is cheap, immediate and available in every analytics platform, which is why it became the default.

Its logic holds together only while every meaningful interaction is a click, and the conversion is a click too.

Where the chain breaks

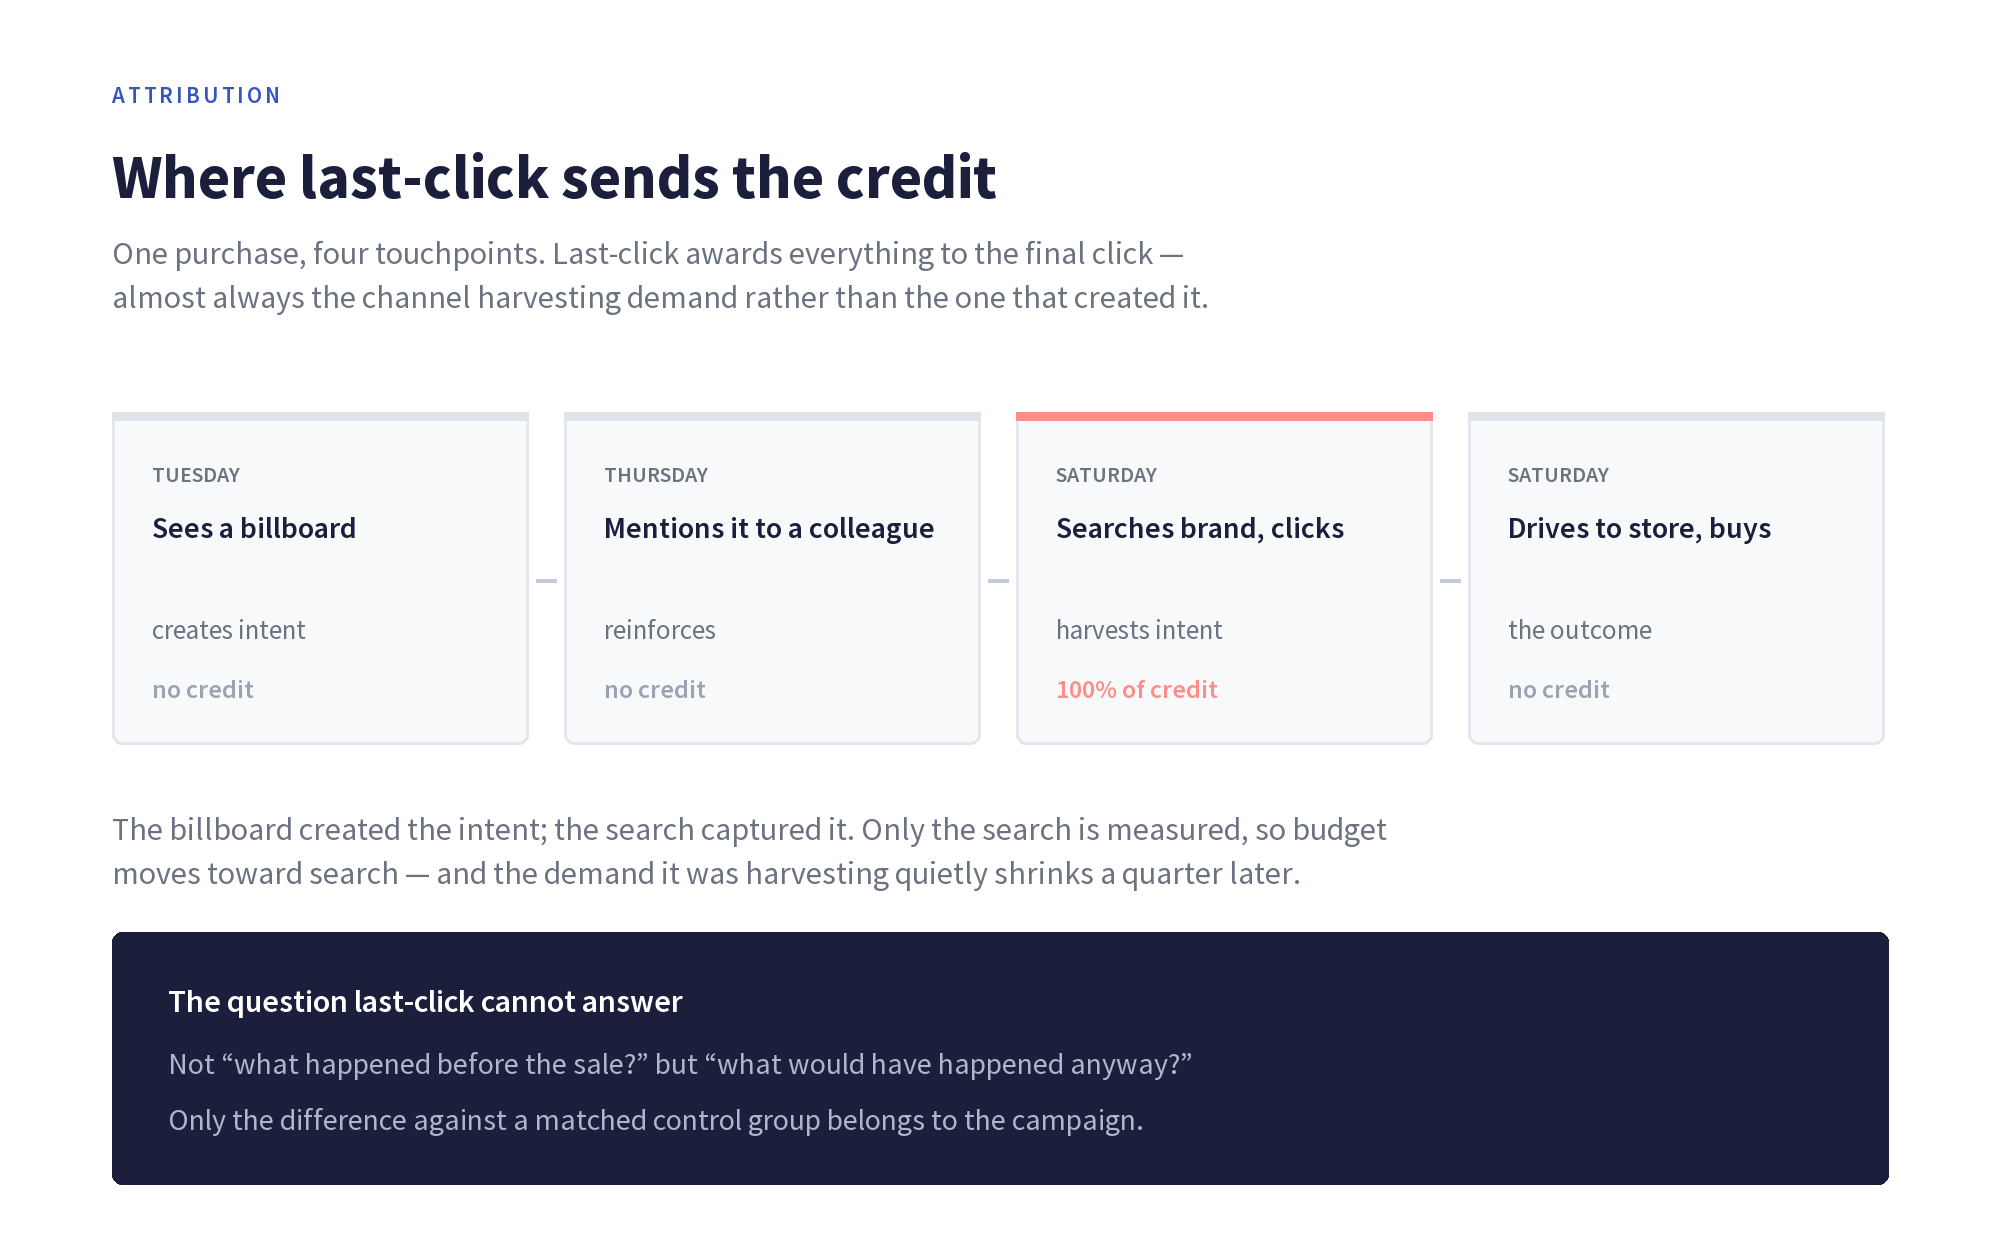
Consider a real sequence. Someone passes a billboard on Tuesday. On Thursday they mention the brand to a colleague. On Saturday they search the brand name, click the top result, and then drive to the store and buy something.

Last-click credits branded search. The billboard that created the intent gets nothing, because no click exists to record. Neither does the conversation. And the purchase itself — happening in a shop, in cash or on a card that analytics never sees — may not register at all.

The failure is not that last-click is imprecise. It is that the thing which caused the outcome is invisible to it by construction.

The structural bias this creates

This is the part that costs money. Last-click does not distribute error evenly; it consistently over-credits the bottom of the funnel.

Branded search sits closest to the conversion, so it collects the credit. Retargeting sits close too. Anything that builds awareness — out of home, radio, print, most social — sits further back and collects nothing.

Budget then follows the reporting. Spend moves toward the channels that appear to convert, which are mostly the channels harvesting demand that something else created. The demand-creating channels look inefficient, get cut, and the harvest shrinks a quarter or two later — by which point the cause is no longer obvious in the data.

Why this matters more for physical retail

For an ecommerce business, last-click is a flawed but functioning model, because the conversion is at least observable. For physical retail the conversion happens outside the measurable system entirely.

That means a retailer using last-click is not measuring a distorted version of the truth. It is measuring a different thing: the digital traffic that preceded a purchase it cannot see.

What to use instead

Approach What it answers Cost of running it
Visit attribution Did exposed people visit more than a matched control group? Low — needs quality location data and a proper control
Geo holdout testing What happens to sales in regions where we stop advertising? Medium — requires withholding spend somewhere
Marketing mix modelling How much does each channel contribute over time? High — needs long history and analyst capacity
Brand lift surveys Did recall and consideration move? Medium — measures attitude, not behaviour

None of these replaces last-click for the jobs it does well. They answer the question last-click cannot: whether the advertising caused anything to happen in the physical world.

The common thread is a control group

What separates all four from last-click is that they compare against a counterfactual. Last-click asks what happened before a conversion. A controlled measurement asks what would have happened anyway — and only the difference belongs to the campaign.

That difference is the only number worth putting in front of a finance director.

Common questions

Is last-click attribution always wrong?

No. For measuring the efficiency of demand-harvesting channels within a digital funnel, it is fast and adequate. It becomes wrong when used to judge channels whose effect is upstream of a click, or outcomes that happen offline.

What is the difference between last-click and multi-touch attribution?

Multi-touch spreads credit across several digital touchpoints rather than one. It is an improvement, but it shares the same blind spot: it can only see interactions that produced a trackable event, so offline exposure and offline conversion remain invisible.

How do you attribute out of home advertising?

Through exposure rather than clicks — identifying who was plausibly near the advert during its run and comparing their subsequent visit rate against a matched unexposed group. Our guide to out of home advertising covers the formats this applies to.

Can offline sales be connected to advertising at all?

Not deterministically for every transaction, and any vendor claiming otherwise is overselling. What can be measured reliably is the incremental change in visits between exposed and control groups, which is the basis of a causal claim rather than a correlational one.

Next steps

If most of your revenue is earned in physical locations, the attribution model in your analytics platform is not measuring most of your business. Our visit attribution and measurement pages set out how real-world outcomes can be measured against a control.

Categories
Footfall & Retail

Footfall Data Explained: Sources, Accuracy and Use Cases

Footfall data answers a question every physical business needs answered and few can answer confidently: how many people actually came, and how does that compare to last month, to the store down the road, or to the competitor across town.

It sounds like a simple count. It isn’t. What gets sold as “footfall data” comes from at least three different collection methods, each measuring something slightly different, with accuracy characteristics that decide whether the number is useful or misleading.

What footfall data is

Footfall data is a measurement of visits to a physical location over a defined period. At minimum it gives you a count. A useful dataset also tells you when those visits happened, how long people stayed, how often they returned, and where they came from.

That last dimension is what separates footfall data from a door counter. A count tells you volume. Catchment, dwell and frequency tell you what the volume means.

The three ways it is collected

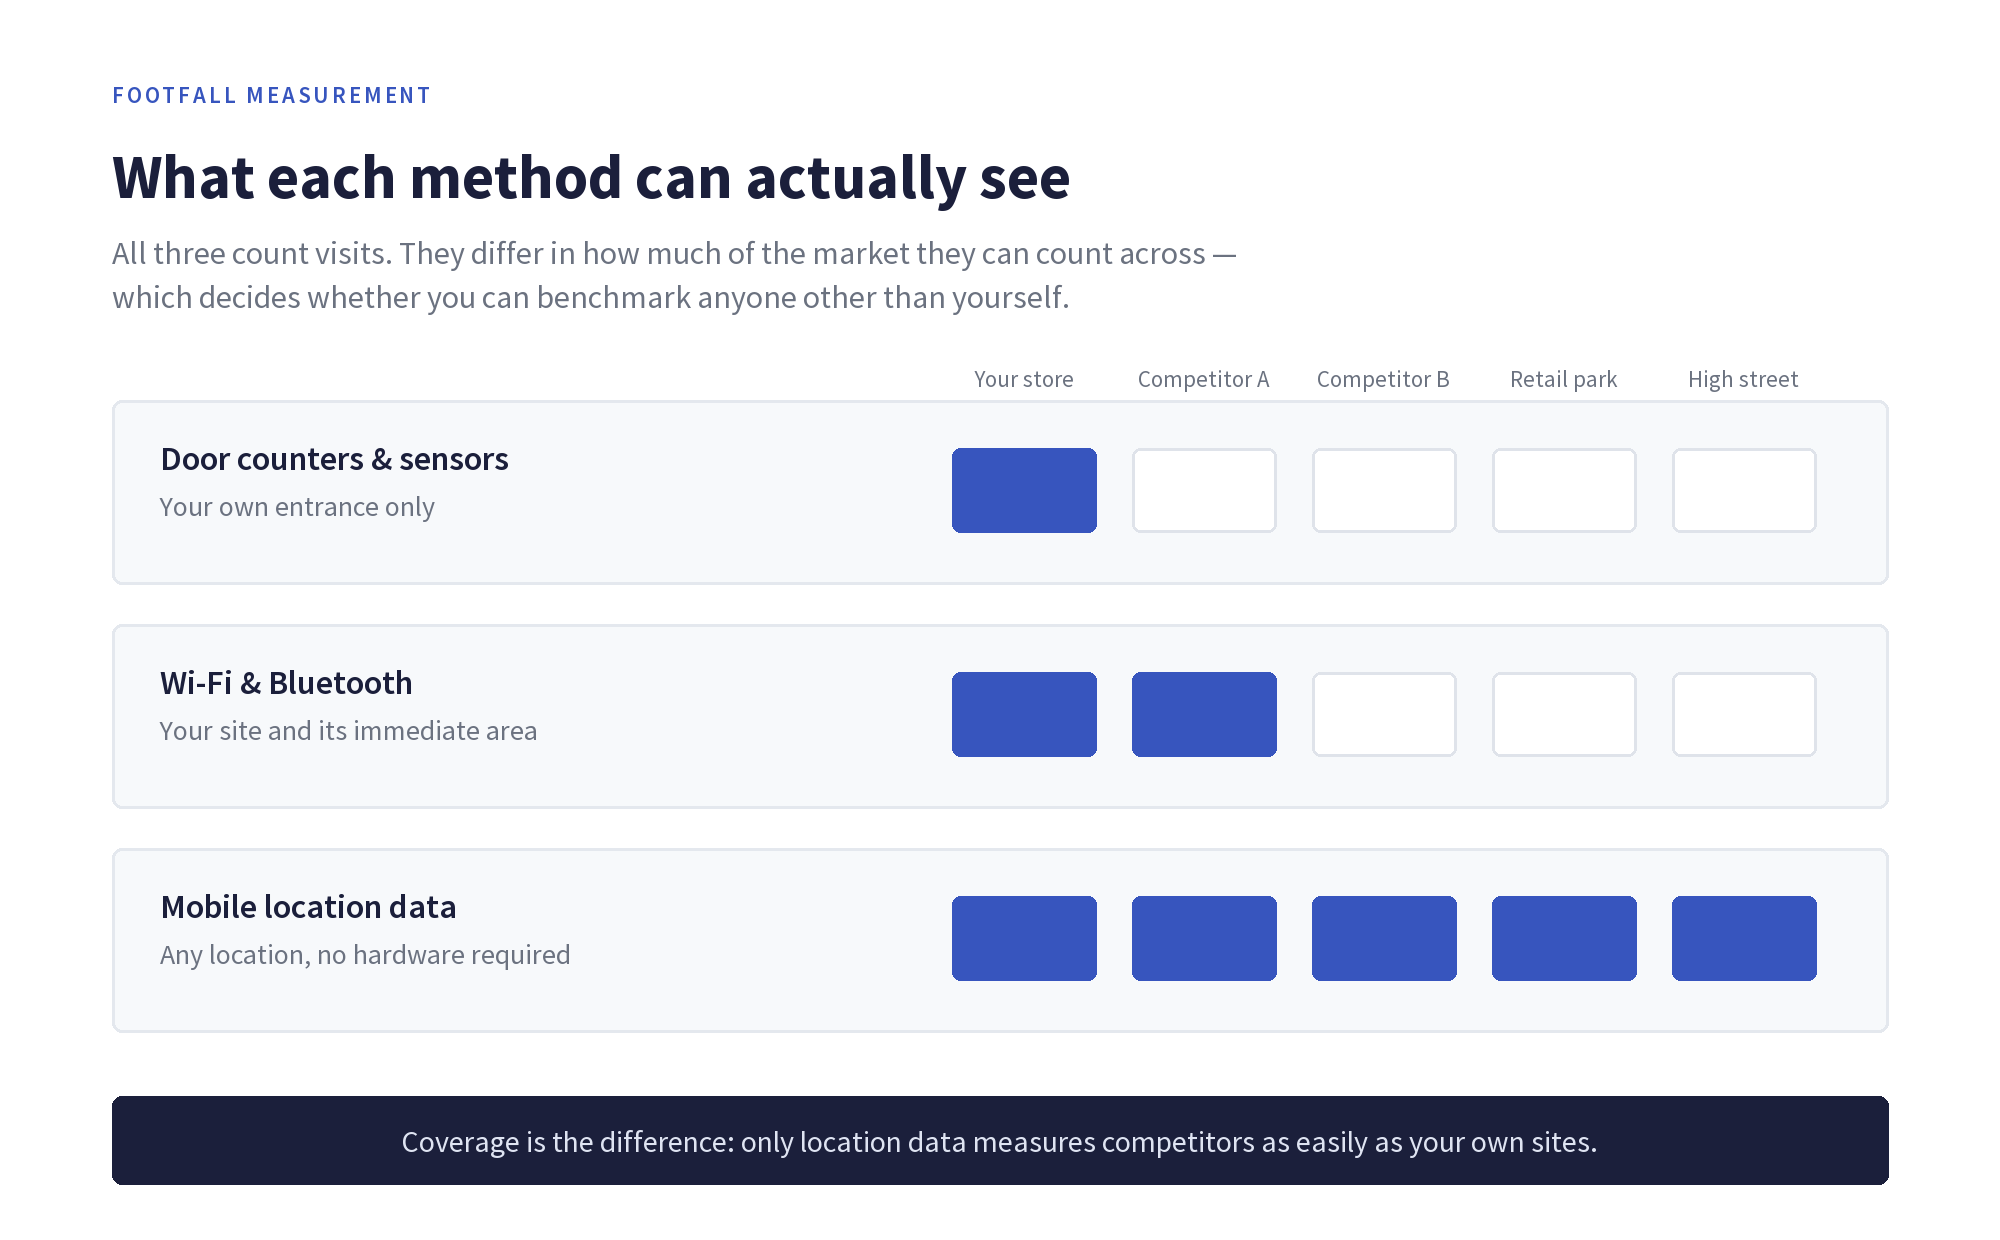
Method What it measures Strength Limitation
Door counters and sensors People crossing a threshold Highly accurate at that door Hardware per site; blind beyond the entrance; no catchment or competitor view
Wi-Fi and Bluetooth sensing Devices with radios enabled nearby Covers an area rather than a line MAC address randomisation has eroded reliability; depends on radios being on
Mobile location data A consented panel of devices, extrapolated Works anywhere with no hardware; enables competitor and market-wide analysis Measures a sample, not everyone; quality depends on panel and polygon accuracy

The practical difference is coverage. Sensors tell you about your own doors. Location data tells you about everybody’s.

What accuracy actually depends on

“Accurate” is used loosely in this market. Four things genuinely determine whether a footfall figure is trustworthy.

Positional accuracy

Consumer location data varies from a few metres to a few hundred. In a retail park that difference is irrelevant. On a high street where three units share a frontage, data accurate to 100 metres cannot tell you which shop someone entered, and will confidently attribute visits to the wrong business.

The location boundary

Visits are counted against a point of interest boundary. A polygon drawn around a rough address rather than the actual premises is the most common cause of inflated numbers, particularly in shopping centres and dense retail where a sloppy boundary catches the pavement, the car park or the neighbouring unit.

Dwell threshold

Someone walking past is not a visitor. A credible methodology applies a minimum dwell time, and the threshold should suit the category: seconds distinguish a passer-by, but a coffee shop and a furniture showroom imply very different visit lengths.

Panel size and extrapolation

Mobile location data measures a sample and scales it up. That scaling is where most of the error lives. A vendor should be able to tell you panel size in the market you care about, how it splits between iOS and Android, and how extrapolation is calibrated — not just quote a global device count.

What it is used for

Site selection

Before signing a lease, footfall data shows how many people pass and stop, where they come from, and what else they visit. Catchment analysis turns a gut feel about a pitch into a measurable one.

Competitor benchmarking

This is the capability sensors cannot provide. Because location data does not require hardware at the site, you can measure a competitor’s visitation as readily as your own, and see whether a drop is your problem or the whole market’s.

Performance measurement

Refits, openings, new formats and trading changes all show up in visit patterns before they show up in reported sales.

Campaign measurement

Footfall is the outcome that offline advertising is ultimately trying to produce. Measuring it against a control group is the basis of visit attribution.

Footfall data: common questions

How accurate is footfall data?

It depends far more on methodology than on the raw data source. Positional accuracy, boundary quality, dwell thresholds and extrapolation each introduce error, and a vendor who cannot describe all four is not in a position to claim accuracy.

Can you measure a competitor’s footfall?

Yes, with mobile location data, because it needs no hardware at the location being measured. This is the main reason retailers and investors use it in preference to sensor networks.

What is the difference between footfall and visits?

Footfall is often used loosely to mean passing traffic, while a visit implies entering and staying. Any serious measurement counts visits using a dwell threshold, so the two are not interchangeable.

Is footfall data personal data?

The underlying location data usually is, and is governed by GDPR in Europe. Aggregated footfall counts are not, but the collection behind them still requires a lawful basis and valid consent.

Next steps

Footfall data is only as good as the boundaries, thresholds and panel behind it. If you are evaluating suppliers, ask about all four before comparing headline numbers — the figures are not comparable until the methodology is.

Our retail and real estate solutions set out how Tamoco approaches each, and our glossary entry on retail foot traffic covers the underlying definition.

Categories
Geospatial Data

H3, Geohash and S2: Choosing a Spatial Index

Latitude and longitude are precise, and almost useless as a database index. A pair of floating-point numbers tells you exactly where something is, but answering “what else is near this?” means comparing against every other point you hold. At any real scale, that does not work.

Spatial indexing solves it by giving every location on Earth a cell — a discrete, addressable area with an identifier. Two things in the same cell are near each other by definition, and proximity becomes a lookup instead of a calculation.

Three systems dominate: Geohash, S2 and H3. They are not interchangeable, and the differences show up in exactly the queries you will run most.

What a spatial index actually does

Every system here does the same two jobs. It subdivides the surface of the Earth into cells at multiple resolutions, and it assigns each cell an identifier that encodes where it sits in that hierarchy.

The differences come down to three decisions each system made: the shape of the cell, how the sphere is flattened before subdividing, and how identifiers are ordered.

Those choices sound academic. They determine whether your neighbour queries are symmetric, whether aggregating to a coarser resolution is exact or approximate, and how badly cell sizes drift as you move away from the equator.

Geohash

Geohash recursively divides a latitude/longitude rectangle in half, alternating between the two axes, and encodes the result in base32. Each additional character narrows the box.

The defining property is that a shared prefix means spatial containment. Everything inside gcpuv is inside gcpu. That makes proximity searching possible with nothing more than a string index — a genuine advantage if your data already lives in a relational database.

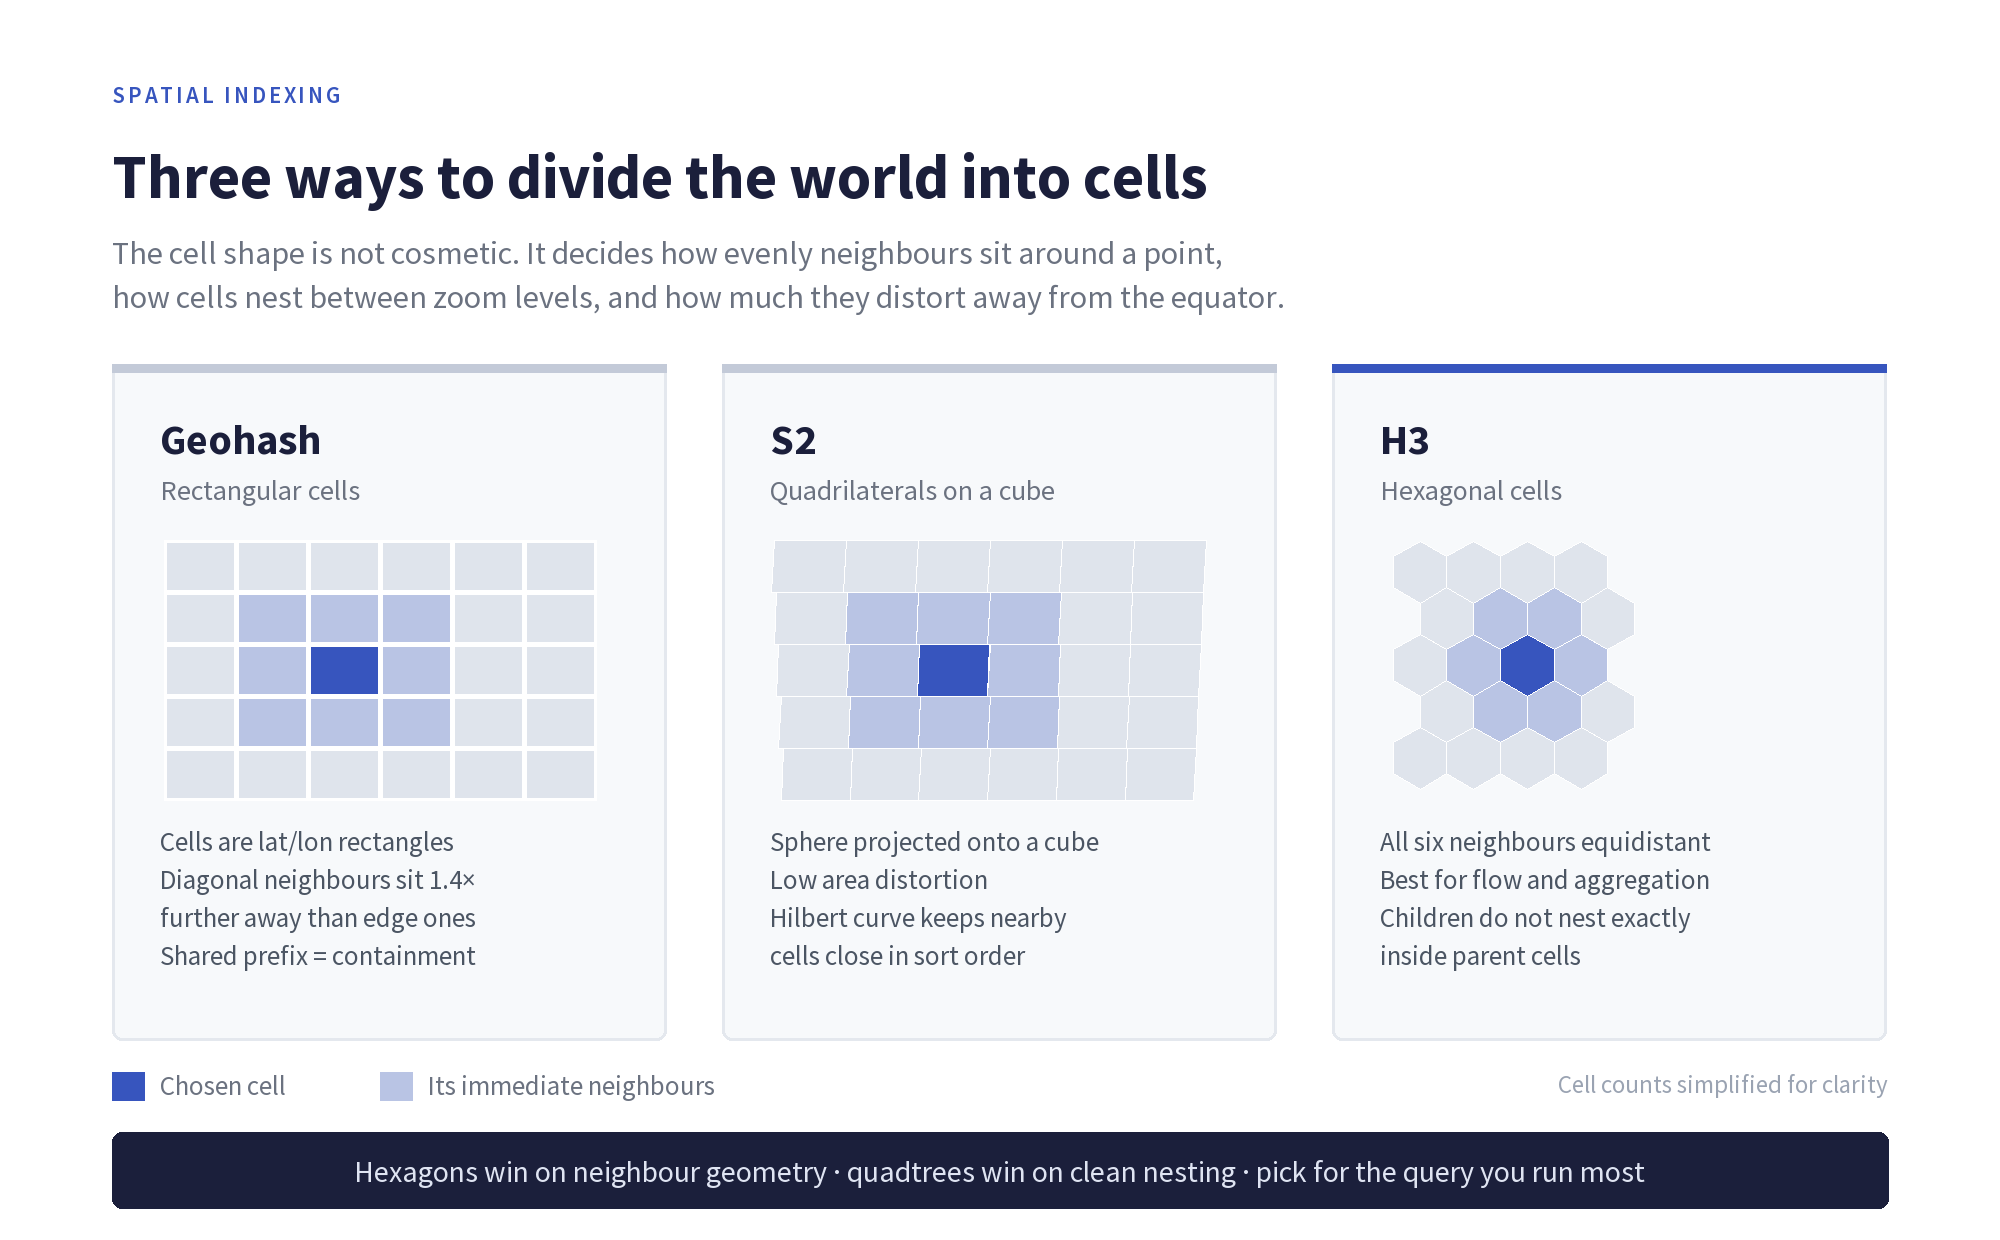
Where it struggles. Cells are lat/lon rectangles, so they narrow steadily towards the poles — a cell in Oslo covers far less ground than one in Nairobi. Neighbours are also asymmetric: the four edge-adjacent cells are closer than the four diagonal ones, so an unweighted “look at surrounding cells” query is subtly biased.

There is also the boundary problem. Two points metres apart can sit either side of a major subdivision and share almost no prefix, so prefix matching alone will miss genuinely close pairs.

S2

S2, from Google, projects the sphere onto the six faces of a circumscribed cube, then runs a quadtree subdivision on each face. Cells are quadrilaterals, and the projection is chosen to keep area distortion low rather than to keep the maths simple.

Cell identifiers are 64-bit integers ordered along a Hilbert curve, a space-filling curve that keeps points close in space close in sort order. That property is why S2 is comfortable in systems built around sorted integer keys and range scans.

S2 runs from level 0 down to level 30, where cells are roughly a centimetre across. Because it is a true quadtree, nesting is exact: every cell decomposes into precisely four children, and rolling up to a coarser level loses nothing.

Where it struggles. Cells are still quadrilaterals, so the diagonal-neighbour asymmetry remains. And identifiers are opaque — you cannot glance at one and infer anything, unlike a Geohash string.

H3

H3, from Uber, tiles the world in hexagons, based on an icosahedron projection, across 16 resolutions from 0 to 15.

Hexagons have one property that neither rectangles nor quadrilaterals can offer: every neighbour is equidistant. A hexagon has exactly six neighbours, all sharing an edge, all the same distance from the centre. For anything involving movement, spread or flow — how traffic moves between areas, how footfall distributes around a site — that symmetry removes a whole class of distortion.

The trade-off is nesting. Hexagons cannot be subdivided into smaller hexagons exactly. H3’s finer resolutions approximate their parents rather than partitioning them, so aggregating between resolutions is slightly lossy. If you need auditable roll-ups, that matters.

There is also a topological quirk worth knowing before it surprises you: you cannot tile a sphere with hexagons alone. Every H3 resolution contains exactly 12 pentagons, inherited from the icosahedron’s vertices. They sit mostly in the ocean, and most workloads never touch one — but code that assumes six neighbours will eventually meet a cell with five.

The same chosen cell and its immediate neighbours under each system. The geometry drives the trade-offs.

Compared directly

Geohash S2 H3
Cell shape Lat/lon rectangle Quadrilateral Hexagon (plus 12 pentagons)
Identifier Base32 string 64-bit integer 64-bit integer
Resolutions ~1–12 characters Levels 0–30 Resolutions 0–15
Nesting Exact, prefix-based Exact, four children per cell Approximate
Neighbour symmetry Asymmetric Asymmetric Uniform
Human readable Yes No No
Best at Prefix search in existing databases Region covering and exact roll-ups Aggregation, flow and modelling

How to choose

The question is not which system is best. It is which query you run most.

Choose Geohash when the index has to live inside a database you already have, when a string index is the mechanism available, or when being able to read an identifier and know roughly where it points has operational value.

Choose S2 when you need exact hierarchical aggregation, when you are covering arbitrary polygons with cells, or when your storage layer is built around sorted integer keys and range scans.

Choose H3 when your analysis is about movement and distribution rather than lookup — binning points for heatmaps, modelling flow between areas, or generating features where an uneven neighbourhood would bias the model.

Plenty of production systems use more than one: H3 for analysis and modelling, S2 or Geohash for storage and retrieval. Converting between them means going back to the underlying coordinates, so store those regardless.

Spatial indexing: common questions

What is a spatial index?

A spatial index divides the Earth’s surface into discrete cells, each with an identifier, so that spatial questions become lookups on those identifiers instead of distance calculations across every record.

Why are hexagons used for spatial data?

Because all six neighbours of a hexagon are the same distance from its centre. Square and rectangular grids have edge neighbours and diagonal neighbours at different distances, which biases any analysis of movement or spread.

Why does H3 have pentagons?

Because a sphere cannot be tiled with hexagons alone. H3 is built on an icosahedron, whose 12 vertices each produce a pentagon at every resolution. They are positioned largely over ocean, but code handling H3 cells should not assume six neighbours.

Is H3 more accurate than Geohash?

Neither is more accurate — accuracy comes from the underlying coordinates. They differ in geometry. H3 gives uniform neighbour distances; Geohash gives readable identifiers and prefix containment. The right answer depends on the query.

Can you convert between Geohash, S2 and H3?

Not directly, because the cell boundaries do not align. Conversion goes via latitude and longitude, which means the original coordinates should always be retained rather than only the cell identifier.

Next steps

Choosing an index is downstream of the data itself. A hexagonal grid does not rescue coordinates that were imprecise to begin with, and no cell system compensates for gaps in coverage.

Our guide to raw geospatial and location data covers what to check in the underlying dataset, and our guide to location data explains the data types these indexes are typically applied to.

Categories
Attribution & Measurement

What Is Visit Attribution? How Location Data Proves Campaign Impact

Visit attribution answers a question digital advertising has always struggled with: did the people who saw an advert actually turn up? Not did they click, not did they search afterwards, but did they physically walk into a store, showroom, restaurant or venue.

For any business whose revenue happens in a physical location, that is the only conversion that matters. This guide covers what visit attribution is, how the measurement actually works, what data it requires, and where it commonly goes wrong.

What is visit attribution?

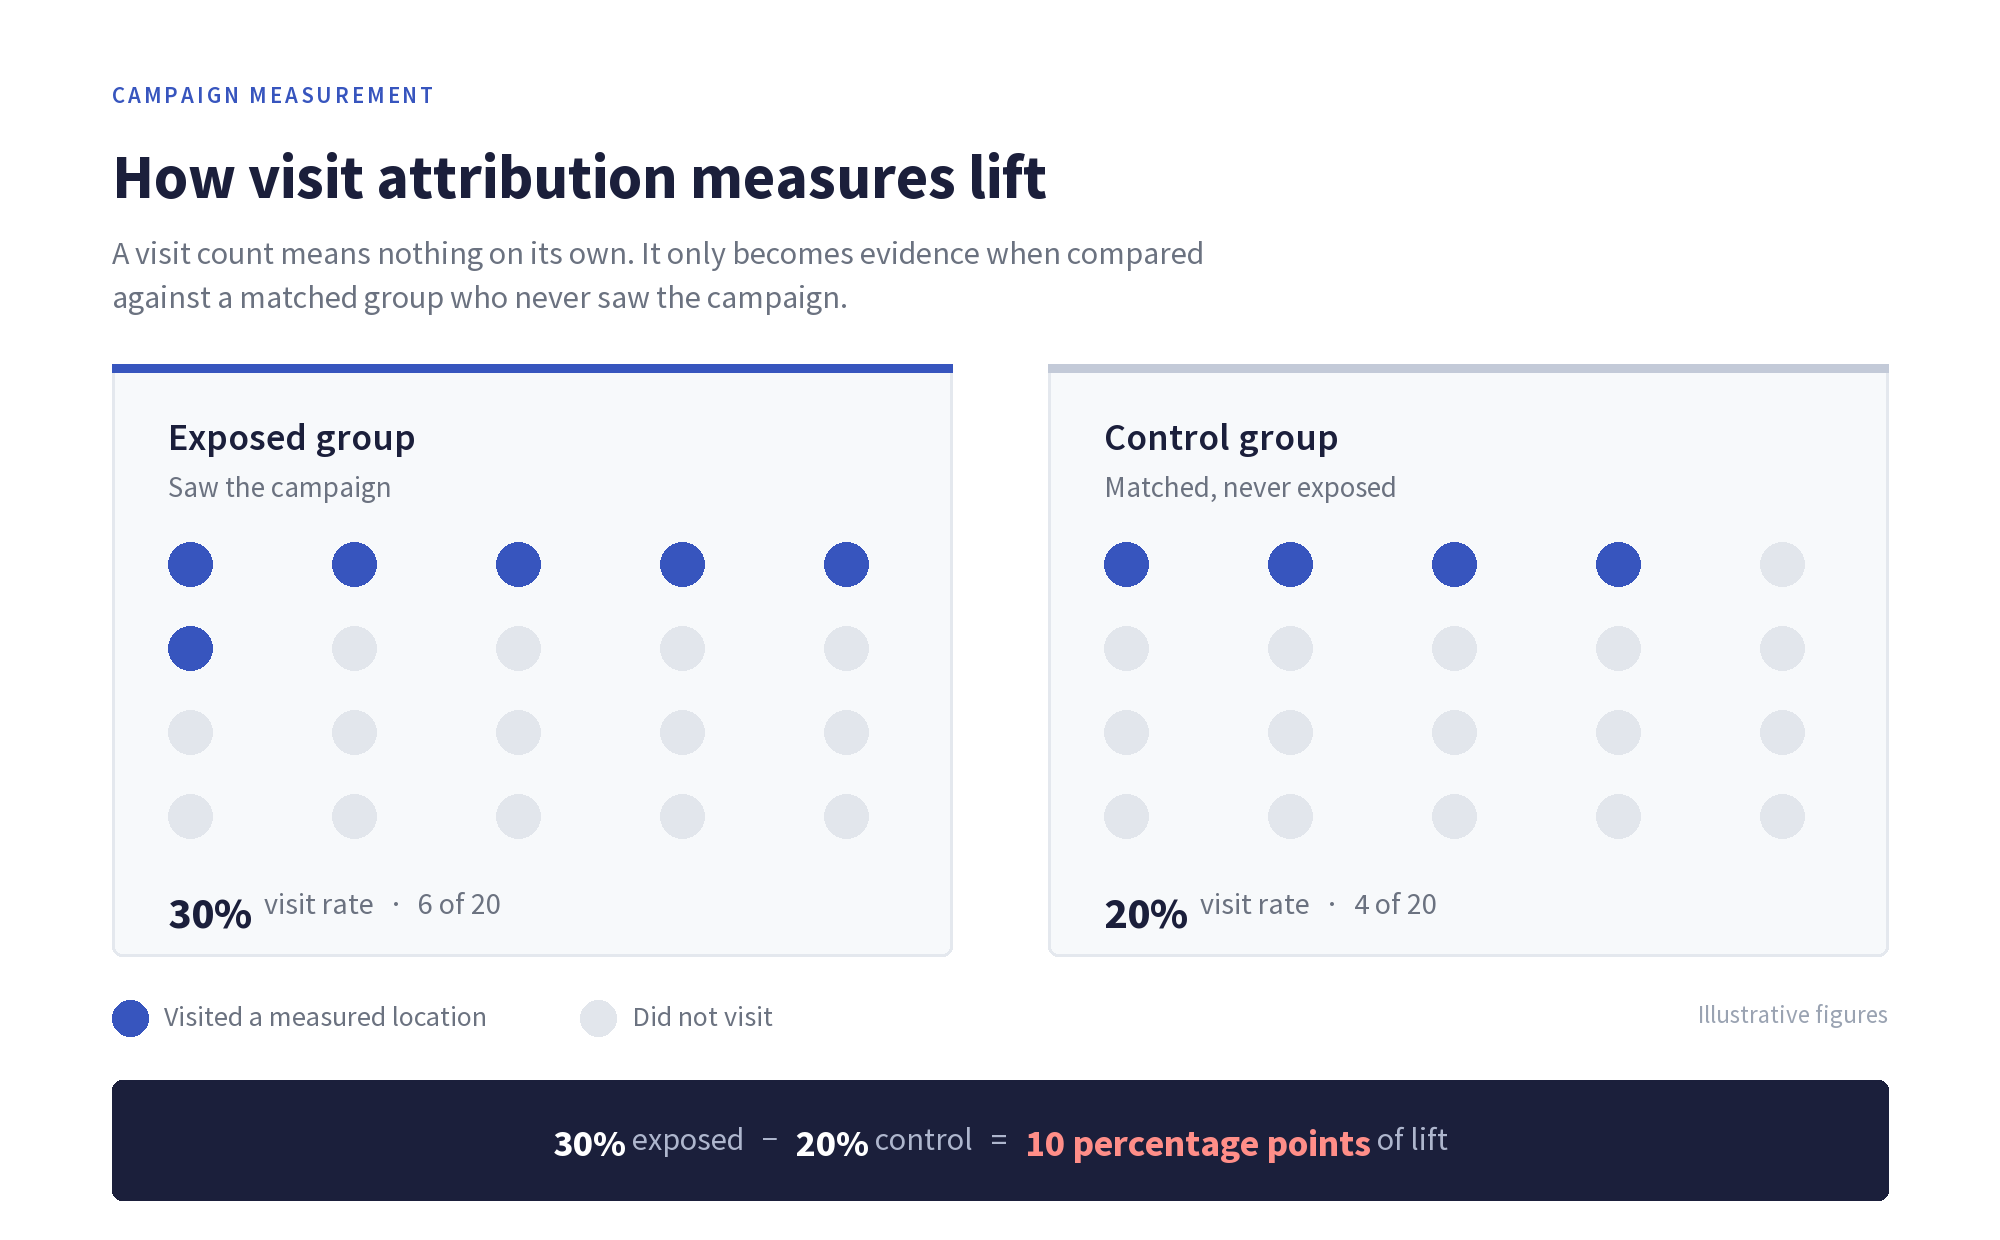
Visit attribution is the practice of connecting advertising exposure to real-world visits. It uses anonymised location data to establish whether people who were exposed to a campaign subsequently visited a relevant physical location, and whether they did so at a higher rate than comparable people who were not exposed.

The output is not a count of visits. It is a comparison — the difference between an exposed group and a control group. That difference is the part the advertising can reasonably claim credit for.

Why click-based attribution fails for physical outcomes

Standard digital attribution follows a chain of clicks ending in an online action. That chain breaks the moment the conversion happens offline.

A shopper might see a billboard on Tuesday, think nothing of it, and visit the store on Saturday having never touched their phone in response. No click exists to attribute. Last-click models resolve this by crediting whatever digital touchpoint happened to come last — usually branded search — which systematically over-credits the bottom of the funnel and under-credits everything that created the intent in the first place.

For out of home, radio, print and much of social, this is not a small measurement gap. It is the whole picture.

How visit attribution works

The method is closer to a controlled experiment than to conventional ad tracking.

1. Define the exposed group

Identify anonymised devices that were plausibly exposed to the campaign — within range of a billboard during its run, or served a mobile impression. Exposure is probabilistic for physical media, and honest measurement treats it that way.

2. Define a control group

Identify a comparable unexposed group, matched on the characteristics that would otherwise explain a difference: location, movement patterns, time of day, device type. Without a matched control, any visit figure is meaningless — busy areas produce visits regardless of advertising.

3. Define the locations that count

Draw accurate boundaries around the places a visit could occur. This is harder than it sounds. A polygon that overlaps a neighbouring unit, a car park or a pavement will record visits that never happened.

4. Measure and compare

Compare visit rates between the two groups over a defined window. The difference is the lift attributable to the campaign.

Visit lift is the difference between the exposed and control groups, not the raw visit count.

Measurement approaches compared

Approach What it measures Strength Limitation
Last-click attribution Final digital touchpoint before an online action Cheap, immediate, universally available Cannot see offline outcomes at all
Estimated impressions How many people passed a site Simple planning metric Measures opportunity, not response
Survey-based brand lift Recall and stated intent Captures attitude, not just behaviour Self-reported; small samples; slow
Visit attribution Actual visits, exposed versus control Measures behaviour, works for offline media Needs quality location data and careful controls
Matched-panel testing Sales in test versus control regions Closest to revenue Expensive, slow, coarse geography

What the measurement requires

Visit attribution is only as good as the data underneath it, and three things determine whether the result means anything.

Positional accuracy. Consumer location data varies enormously in precision. Data accurate to within a few metres can distinguish one shop from its neighbour; data accurate to a hundred metres cannot, and will quietly attribute visits to the wrong business.

Panel scale and consistency. The exposed and control groups must both be large enough that the difference between them is a signal rather than noise, and the panel must be stable across the measurement window.

Consent and provenance. The data must be collected with valid consent and be traceable to its source. This is a compliance requirement, and it is also a quality signal — supply chains that cannot explain their provenance usually cannot explain their accuracy either. Our guide to data transparency and consented collection covers what to ask for.

Where visit attribution goes wrong

Claiming correlation as causation. Reporting raw visits from an exposed group without a control group produces a number that looks impressive and means nothing. People near a billboard were always going to visit nearby shops.

Sloppy location boundaries. Polygons drawn around a rough address rather than the actual premises are the most common source of inflated results, particularly in dense retail environments and shopping centres.

Measurement windows that flatter. A window long enough will capture visits that would have happened anyway. The window should reflect a realistic decision cycle for the category — same-day for convenience, weeks for considered purchases.

Ignoring seasonality. A campaign running into a peak trading period will show lift that the calendar, not the creative, produced. Controls need to account for it.

Visit attribution: common questions

What is visit attribution in advertising?

Visit attribution is a measurement method that connects advertising exposure to physical visits, using anonymised location data to compare visit rates between people exposed to a campaign and a matched group who were not.

How is a store visit actually detected?

By comparing anonymised device location against a defined boundary for the location, applying a dwell-time threshold so that passers-by are not counted as visitors. The threshold matters: a few seconds indicates someone walking past, while several minutes indicates a genuine visit.

Can out of home advertising be attributed this way?

Yes, and it is one of the main reasons the channel has become measurable. Exposure is inferred from presence near the advert during its run rather than from a click. Our guide to out of home advertising covers the formats this applies to.

What is visit lift?

Visit lift is the difference in visit rate between the exposed and control groups, usually expressed as a percentage increase. It isolates the campaign’s contribution from visits that would have occurred anyway.

How long after a campaign should visits be measured?

It depends on the purchase cycle. Convenience and food categories tend to use short windows of a day or two; considered purchases such as furniture or vehicles need weeks. The window should be set before the campaign runs, not chosen afterwards to suit the result.

Next steps

Visit attribution turns offline advertising from an act of faith into something measurable — but only when the underlying location data is accurate, consented and matched against a proper control.

If you are evaluating measurement for a real-world campaign, our visit attribution and measurement product pages set out how Tamoco approaches each of the requirements above, and our guide to location data explains the data types involved.

Categories
Business

Top 6 Synthetic Data Platforms in the Cloud to Watch in 2026

Synthetic data is transforming how organizations handle data. Companies can now generate artificial datasets that behave like real ones, instead of using actual customer or business data that comes with privacy and compliance risk. These datasets keep patterns, correlations, and relationships intact, making them useful for software testing, AI and ML training, and analytics – without exposing sensitive information.

Lately, advanced and cloud-based synthetic data generation platforms are becoming essential for businesses trying to balance innovation with privacy. Below are 6 platforms to watch in 2026, ranging from enterprise-grade solutions to developer-friendly tools.

1. K2view Synthetic Data Management

K2view synthetic data generation tools are a standalone solution that manages the synthetic data lifecycle end to end, including source extraction, subsetting, pipelining, and synthetic test data operations. Its patented technology maintains referential integrity by creating a schema that serves as a blueprint for the data model, so relationships stay consistent while producing realistic datasets for software testing and ML training.

Key features:
• GenAI and rules-based data generation methods
• Architecture designed to maintain referential integrity across sources
• Dozens of built-in masking and anonymization capabilities
• Seamless integration with CI/CD pipelines

Why it’s great:
K2view is built for enterprise-scale synthetic data across complex, heterogeneous environments, and it’s strong when teams need self-service provisioning and consistent relationships across multiple systems.

Watch out:
Configuration and deployment require planning, and it’s best suited to large enterprises rather than SMBs.

2. Mostly AI

Mostly AI makes it easy to generate high-fidelity synthetic datasets that mirror real data while staying privacy-safe. It has a clean interface that helps non-engineers get useful results quickly – especially for AI and analytics use cases.

What it can do:
• Privacy-safe generation and de-identification
• Fidelity metrics that compare real and synthetic data
• Multi-relational dataset support
• Cloud-based workflow with API integration

Why it’s great:
Fast, easy to use, and strong for teams that need realistic synthetic data without investing in a steep learning curve.

Watch out:
Limited control over hierarchical datasets and less flexibility for complex relationships or fine-grained parameter control.

3. YData Fabric

YData Fabric combines data profiling and synthetic generation to support high-quality data for AI and ML. It supports tabular, relational, and time-series data, and it’s often used when teams want synthetic data plus strong data readiness workflows.

What it can do:
• Multi-type data generation (tabular, relational, time-series)
• Automated data quality assessment
• Integrated ML pipeline workflows (no-code and SDK options)

Why it’s great:
Supports diverse AI projects and improves ML data readiness, especially when the team wants synthetic generation plus profiling and quality automation.

Watch out:
It typically requires data science expertise to get the most out of it, and it does not comply with all data privacy laws out of the box.

4. Gretel Workflows

Gretel is developer-focused, letting teams embed synthetic data generation directly into pipelines. It’s a strong fit for CI/CD, Dev/Test workflows, and ML training pipelines where automation and integration matter most.

What it can do:
• Pipeline scheduling and automation
• Support for structured and unstructured data
• No-code and low-code workflow options
• Privacy-safe dataset creation

Why it’s great:
Smooth workflow integration, strong automation, and API-friendly implementation for engineering teams embedding synthetic data into everyday delivery pipelines.

Watch out:
Cloud dependency is a common limitation, and it’s still geared primarily toward developer-led teams.

5. Hazy (SAS Data Maker)

Hazy (now part of SAS Data Maker) focuses on privacy-preserving synthetic data generation using differential privacy and anonymization. It’s a natural fit for regulated industries like financial services and healthcare where safe data sharing is a priority.

What it can do:
• Differential privacy and anonymization for privacy-preserving synthetic data
• Compliance-first design and enterprise-grade support
• Secure on-prem or cloud deployment options

Why it’s great:
Strong for high-control environments that need compliance-focused synthetic data and safer sharing across teams or partners.

Watch out:
Setup can be complex and time-consuming, so it’s typically best for highly regulated organizations with specialized teams.

6. SDV (Synthetic Data Vault)

SDV is an open-source Python library for generating tabular, relational, and time-series synthetic data. It’s flexible and cost-effective, especially for technical teams that want control and customization without paying for enterprise tooling.

What it can do:
• Multiple generative models (including CTGAN-style approaches)
• Relational data and constraint support
• Python SDK integration and open-source development

Why it’s great:
Highly customizable and budget-friendly, with strong parameter control for data science teams.

Watch out:
Requires manual setup and technical skill, and it lacks enterprise-grade governance and support.

Why It Matters

Synthetic data is no longer optional. It’s becoming essential for AI, testing, and analytics. The most mature tools now combine AI-driven realism, governance, and integration with modern workflows. As privacy regulations tighten, enterprise platforms raise the compliance bar, while open-source options keep synthetic data accessible for technical teams.

In 2026, being smart with synthetic data will help you go fast, go safe, and go compliant. No two ways about it. Compare your options and go with the one that fits your needs, your team’s skills, and your budget.

Categories
Business

5 Next-Gen Data Masking Solutions to Protect Sensitive Information in 2026

Sensitive data is everywhere these days. From credit card details and health records to employee information and client databases, organizations have no shortage of valuable information that people with wrong intentions would love to get their hands on. Firewalls and encryption are still relevant traditional security measures, but they are not enough anymore. That’s where data masking comes into play. It helps replace actual data with realistic-looking but fake data to ensure that the businesses can still utilize the information without revealing sensitive details.

Now, the interesting part is how much data masking has evolved. Scrambling numbers or replacing names? Not anymore! We’re in 2026 and looking at next-generation solutions that are smart, real-time, and designed to secure data in some of the most advanced digital environments.

Let’s explore some of the most promising data masking solutions of this year.

K2view

K2view Data Masking is a stand-alone, best-of-breed solution for enterprises that want to protect sensitive information at scale, quickly and easily. Its AI-assisted automation takes care of discovering PII across structured and unstructured data, applies role-based access control, and generates compliance reports with ease.

With over 200 pre-configured masking methods—customizable without coding—K2view allows enterprises to use dynamic masking for real-time operations or static masking for development and business analytics. It integrates seamlessly with nearly any system, from relational databases and NoSQL sources, through legacy and flat files, maintaining referential integrity between environments.

What sets K2view apart is its ability to handle unstructured data. Sensitive details in PDFs or images aren’t missed; the platform can digitize and mask them while keeping consistency with structured datasets. Honored as a Visionary in the 2024 Magic Quadrant of Data Integration by Gartner, K2view remains a reliable option among companies that need to find a balance between security, compliance, and usability.

Delphix

Delphix has always been a favorite among testers and the DevOps teams, and it doesn’t disappoint in 2026. Its data masking solution is velocity-oriented, i.e., development and testing teams can access secure, production-like data at a blistering pace. The best thing about it, though, is that it ensures that the data it masks looks and feels real. This reduces the risk of bugs or errors that come from working with fake-looking placeholders.

Delphix offers the ideal combination of speed and security in a world where business can never afford to wait. It prevents sensitive information from leaking into unsafe environments without productivity loss, whether you are spinning up a brand new application or are dealing with a system migration.

Informatica

Informatica has been in the data business for over decades, and it keeps reinventing itself to remain relevant. In 2026, its data masking solution is a combination of old-fashioned reliability with more modern technologies, such as the use of AI to find sensitive data.

While Informatica previously had to rely on predefined rules, it is now able to discover patterns in your data that could be lurking PII or sensitive attributes that you never knew existed. It is proactive and, therefore, suitable for individuals who prefer to prevent problems before they arise. Lastly, it works well with cloud platforms, so businesses don’t have to compromise modernization for security—it can do both.

Oracle Data Masking and Subsetting

Oracle is still a leader in the enterprise software market, and its data masking and subsetting solution remains effective even in 2026. Designed to handle large data sets characteristic of Fortune 500 companies, it does not merely mask data; it also subsets data. That means enterprises can create smaller, more secure data sets for development or testing needs without losing any sensitive information.

Scalability has always been the real strength of Oracle. Whether you’re moving terabytes or petabytes, the solution does not buckle under pressure. If you’re a company already invested in the Oracle environment, then it’s a logical extension that increases security without impacting business operations.

Protegrity
Protegrity’s approach to data masking in 2026 feels especially aligned with today’s privacy-driven climate. It provides organizations with the option of how they would like their data to be secured, either by masking, tokenization, or both. What makes it special is that it’s aimed at preserving data’s usability even when it’s anonymized so that analytics and reporting can still generate meaningful insights.

For global organizations that have to comply with GDPR in Europe, HIPAA in the US, and other regional data laws, Protegrity can offer flexibility to tailor policies for different needs without developing a patchwork of tools. This single methodology makes compliance less of a nightmare and more of a smooth sailing.

Conclusion

The need to protect sensitive information isn’t going away—in fact, it’s becoming more urgent every year. Cybercrime is only becoming slyer, data volumes are growing continually, and compliance regulations are becoming more rigorous. The first line of defense in 2026 consists of the products we just reviewed—K2view, Delphix, Informatica, Oracle, and Protegrity. And what’s exciting is that each one takes a slightly different approach, so businesses can choose the tool that best fits their needs.

Categories
Geospatial Data

How Gaming Companies Use Geospatial Data To Serve Their Customers

Geospatial data, also known as geographic data or spatial data, is collected and used more than ever by today’s leading gaming companies to better serve their customers. 

On this page, we will be taking a closer look at how gaming companies use geospatial data to improve their products and/or services and customer experience, why it is so important to modern gaming platforms, and how your location affects the types of promotional offers you see. 

We will also discuss several other ways that iGaming brands use data to personalise content before revealing whether geospatial targeting actually improves the customer experience. 

What Is Geospatial Data and How Is It Collected?

The term geospatial data refers to a broad range of location-specific information, so anything with a geographic component. It can be collected via several means, including drones and satellites (also known as remote sensing), Global Positioning System (GPS), surveys, and aerial photography. 

Examples of geospatial data include satellite imagery, maps, addresses, coordinates, and descriptive attributes (such as population density, land use, and population density). When collected, it can be analysed to reveal patterns and relationships, and to determine precise locations on Earth. 

Why Is Location Data Crucial to Modern Gaming Platforms?

Geospatial data is crucial to modern gaming platforms because it helps operators/business owners provide far more relevant location-based services tailored to individual regions, which can significantly enhance the overall user experience on various levels. 

Besides personalised experience, the gathering of location data and the strategic use of this information are crucial in the following ways:

  • Geospatial location data enables gaming platform operators to deliver geo-targeted advertising campaigns, promotional offers, and in-game purchases, which helps increase revenue
  • It helps to detect and prevent a range of fraudulent activities, such as when players try to access geo-restricted platforms, products, services, and other restricted content using virtual private networks (VPNs)
  • Geospatial data/geo location detection software enables operators to comply with location and international laws and regulations regarding gaming/gambling laws
  • It also helps bolster fair play by detecting and preventing players from cheating in specific games on certain gaming platforms 
  • It helps operators understand player behaviour and how it varies dramatically from one region to another

Additionally, it can help developers optimise how they design levels and how challenging they make those levels, and enables them to tweak and enhance specific in-game features and gameplay mechanics that are popular in certain regions to make the gameplay experience more immersive, engaging, memorable, rewarding, and interactive. 

How Does Your Location Affect What Promotions You See?

Let’s just say that you live in Australia or New Zealand, but want to try a US-focused iGaming platform, you won’t have much luck. However, if you’re a US resident, you’ll notice that finding a FanDuel casino promo code is relatively straightforward. 

If you are searching from Australasia, you won’t be able to use any bonus codes that you find because FanDuel doesn’t yet accept real cash wagers from players living in these two regions. Instead, you should look for a site that accepts real money wagers from players in your region. 

The geospatial data and geo-location software used by the FanDuel operator would reveal that you are based in Oceania, not the US, meaning that although you could access the website, but wouldn’t be able to register an account on this platform because it doesn’t accept players from this region. 

Therefore, you wouldn’t be able to deposit, play any of their games in the real money mode, claim any of their bonuses, or withdraw winnings because the products and services on that platform simply wouldn’t be available to you. 

Even if you tried to mask your true location by using a VPN too to make it appear as though you were in the US, not Australia or New Zealand, their sophisticated VPN-detectors would also reveal that you were using a VPN to sidestep local and international laws, and you would be asked to switch it off, thus revealing your true location. 

Alternatively, you might be able to visit the website from this region, but during the sign-up process, you would be required to enter a US address because FanDuel doesn’t even have Australia or New Zealand address options available in their list of countries on their online registration form. 

Online casino promotions are also targeted to different regions for various reasons, so it’s always best to stick to playing on platforms that specifically cater to people in your region because those promotions will always be far more relevant. 

Are There Other Ways Casinos Personalise Content with Data?

The iGaming industry’s safest online casinos also use various data-gathering AI-powered tools and machine learning technology to personalise the user experience in various other ways. 

For example, artificial intelligence can ‘non-intrusively’ monitor each player’s account to deliver better game suggestions, more rewarding bonuses and promotions that are far more personalized and tailored to the individual, and far better player support and customer service. 

Does Geospatial Targeting Actually Improve Customer Experience?

Yes. Geospatial targeting, especially in the traditional gaming and iGaming sectors, significantly enhances the overall user experience on so many different levels. 

It helps boost user engagement and customer satisfaction and enables operators to deliver more relevant services and products in real-time based on each user’s specific global location. 

Operators can also deliver proactive resolutions to any technical issues players may encounter on their platforms, or provide more relevant answers/solutions to any questions those players may have about their account on that gaming platform. 

By using this data correctly and ensuring that players can only access specific content, operators can improve operational efficiency, reduce costs, and deliver optimised services, giving them a competitive advantage over their rivals. 

Geospatial targeting has become one of the most powerful tools out there for business owners. It allows operators to boost revenue, enhance the user experience, improve customer service, and streamline their day-to-day operations. 


Categories
Uncategorized

TOP 5 High RTP Games at Nine Casino for Italian Players

Introduction

For Italian players chasing the thrill of online casinos and the sweet taste of victory, Nine casino 2 emerges as a prime destination. The secret weapon for savvy players? High RTP games. RTP, or Return to Player, represents the percentage of wagered money a casino game is expected to pay back to players over time. Essentially, the higher the RTP, the better your odds of winning in the long run. It’s no surprise that online casinos are exploding in popularity in Italy, and with that comes a growing demand for games that offer a fairer chance.

This guide cuts through the noise and dives straight into the top 5 high RTP games available at nine casino. We’re not just talking about slight advantages; we’re talking about games carefully selected to tilt the odds ever so slightly in your favor. Prepare to discover the games that give you the best chance to walk away a winner at Nine Casino. Get ready to maximize your playtime and your potential payouts!

Understanding RTP (Return to Player)

RTP, or Return to Player, is a term frequently encountered in the world of casino games, both online and offline. It represents the percentage of all wagered money that a game is expected to return to players over an extensive period. Think of it as the inverse of the house edge; if a game has an RTP of 96%, the house edge is 4%.

The RTP is calculated by game developers by simulating millions, even billions, of game rounds. This massive dataset reveals the game’s long-term payout rate with remarkable accuracy. The resulting percentage gives players an idea of their potential returns. For example, if someone wagers €100 on a game with a 96% RTP, theoretically, they could expect to receive €96 back over a long play session.

It’s important to understand that RTP is a theoretical calculation, not a guarantee. A high RTP doesn’t mean someone will win every time they play. Randomness and variance play significant roles in the short term. One can experience winning streaks and losing streaks regardless of the stated RTP. Hit frequency, which dictates how often a game produces a winning outcome, is a separate factor that influences the gameplay experience. A game might have a high RTP but low hit frequency, resulting in less frequent but potentially larger wins, and vice versa.

Therefore, while RTP is a useful metric for comparing different casino games, it shouldn’t be the sole determinant in choosing which game to play. Consider personal preferences, volatility, bonus features, and overall enjoyment as equally important factors. Always remember that gambling should be seen as entertainment, and one should only wager responsibly and within their means.

Why RTP Matters for Italian Players

For Italian online casino players, understanding Return to Player (RTP) is essential. The Italian online gambling market operates under a strict legal framework, overseen by the Agenzia delle Dogane e dei Monopoli (ADM), formerly known as AAMS. An ADM license signifies that an online casino adheres to Italian gambling laws, providing a layer of player protection. Because of these regulations, RTP becomes a critical factor. It indicates the theoretical return a player can expect over time. Choosing ADM-licensed casinos ensures fair play and that published RTP rates are closely monitored, maximizing entertainment within a secure environment.

Nine Casino: A Brief Overview

Nine Casino has carved out a niche in the online gaming world, establishing itself as a noteworthy platform for players seeking a diverse and engaging casino experience. While specifics regarding awards may vary, the casino’s commitment to providing a secure and entertaining environment is evident.

A cornerstone of Nine Casino’s operation is its adherence to regulatory standards. Details on licensing information are generally available on the casino’s website, demonstrating their commitment to fair play and responsible gaming. This is especially important for players in regions like Italy, where compliance with local gambling regulations is paramount.

The heart of any online casino lies in its game selection, and Nine Casino does not disappoint. Boasting a library of thousands of games, players can explore a wide array of options, from classic slots to cutting-edge video slots, table games, and live dealer experiences. These games are powered by some of the industry’s leading game providers, ensuring a high-quality and engaging gaming experience. This vast selection caters to a wide range of player preferences, making Nine Casino a versatile choice for both casual players and seasoned veterans.

Recognizing the importance of accessibility and convenience, Nine Casino typically offers various customer support channels, which could include live chat, email, and a comprehensive FAQ section. The availability of Italian language support enhances the experience for Italian players, fostering a sense of familiarity and ease of use.

Top 5 High RTP Games at Nine Casino

Nine Casino offers a thrilling selection of games, but for those seeking the best bang for their buck, focusing on games with a high Return to Player (RTP) percentage is a smart move. RTP represents the percentage of wagered money a game is expected to pay back to players over time. While it’s not a guarantee of individual wins, it’s a good indicator of potential value. Let’s dive into five high-RTP games you can find at Nine Casino, mixing slots and table games for variety.

Game 1: Book of 99

Game Type: Slot

RTP Percentage: 99%

Description: Prepare for an odyssey with “Book of 99,” a slot that takes you on a journey through ancient Greece. The quest? To collect 99 Book symbols to trigger the free spins round. The free spins round offers expanding symbols, boosting your chance to win big. Even better, it boasts an incredible 99% RTP, making it the best in business.

Volatility: High

Why it’s appealing: The high RTP is the obvious draw, but the unique symbol collection mechanic and the popular expanding symbols feature in free spins add an extra layer of excitement. “Book of 99” is fully optimized for mobile play.

Game 2: Blackjack (Various Variants)

Game Type: Table Game (Card Game)

RTP Percentage: ~99.5% (depending on the variant and player strategy)

Description: Blackjack isn’t just a casino classic; it’s a strategic battle against the dealer. The goal is simple: get a hand value as close to 21 as possible without exceeding it. Different Blackjack variants exist, each with slightly different rules that influence the RTP. Find the one that you like most and start winning.

Volatility: Low to Medium (depending on betting strategy)

Why it’s appealing: Blackjack offers a combination of skill and luck. You can influence the outcome through your decisions. Its high RTP, especially when playing with optimal strategy, makes it a favorite for serious players. Enjoy Blackjack on any device, anytime.

Game 3: Jokerizer

Game Type: Slot

RTP Percentage: Up to 98% (in Jokerizer Mode)

Description: “Jokerizer” is a classic-style slot with a modern twist. Land a win, and you can enter Jokerizer Mode, where you pay a set amount per spin for a chance to win a mystery prize. The RTP increases significantly in this mode, making it an attractive option for those willing to take the risk.

Volatility: Medium to High

Why it’s appealing: The Jokerizer Mode adds a unique gamble feature to the classic slot experience. The potential for big mystery wins and the boosted RTP make it a thrilling choice. You can play this game on almost any device.

Game 4: Baccarat

Game Type: Table Game (Card Game)

RTP Percentage: ~98.94% (on Banker bet)

Description: Baccarat is a game of chance where you bet on either the “Player,” the “Banker,” or a “Tie.” The hand closest to a total of 9 wins. Betting on the “Banker” offers the highest RTP, although a commission is usually charged on Banker wins.

Volatility: Low

Why it’s appealing: Baccarat is easy to learn and offers a relatively high RTP, especially on the Banker bet. Its simple gameplay and potential for quick wins make it a popular choice. You can lay Baccarat on your PC, tablet or mobile.

Game 5: European Roulette

Game Type: Table Game (Roulette)

RTP Percentage: 97.3%

Description: European Roulette features a single zero, giving it a higher RTP compared to American Roulette (which has both a single and double zero). Bet on numbers, colors, or sections of the wheel and watch as the ball determines your fate.

Volatility: Medium to High (depending on the bet type)

Why it’s appealing: Roulette is a classic casino game that offers a variety of betting options and payout potentials. European Roulette’s single zero provides a better RTP than its American counterpart. This game is playable on any platform.

How to Maximize Your Winnings (and Minimize Losses)

The thrill of the game is undeniable, but responsible gambling is paramount for a positive experience. It’s about enjoying the ride without letting it steer you off course. Winning isn’t guaranteed, so managing risk effectively is key.

Smart Bankroll Management

Think of your gambling bankroll as entertainment money – funds specifically allocated for fun, not essential expenses. Before you even place your first bet, determine a budget you’re comfortable losing. Once that money’s gone, the game is over for the day. Avoid dipping into other funds or chasing losses; this is an almost certain route to frustration and financial strain.

Understanding Volatility

Every game has a different level of volatility, or risk. High-volatility games offer the potential for large payouts but also come with longer dry spells. Low-volatility games offer more frequent, smaller wins. Understanding a game’s volatility allows you to tailor your bets and manage your expectations accordingly. If you’re risk-averse, stick to low-volatility options. If you’re feeling lucky and have the bankroll to support it, high-volatility games might be your thing.

Recognizing Gambling Risks

Gambling should never be viewed as a source of income or a way to solve financial problems. If you find yourself borrowing money to gamble, hiding your gambling habits from loved ones, or feeling anxious when you’re not gambling, it’s time to seek help. Remember, numerous resources are available to assist those struggling with gambling-related issues in Italy. Don’t hesitate to seek help; many organizations and professionals are dedicated to helping people gamble responsibly.

Gambling for Entertainment

Ultimately, casino games are just games! Treat them as such. The primary goal should be enjoyment, not profit. When you are no longer having fun, step away. By setting limits, understanding the risks, and managing your bankroll wisely, you can enjoy the excitement of gambling without it taking control of your life.

Conclusion

In conclusion, understanding and utilizing high RTP games can be a strategic advantage for Italian players at Nine Casino. Games like Blackjack, Baccarat, and specific slots offer a higher return to player, potentially improving your odds of winning. Remember titles such as “Book of 99” and “Mega Joker” which stand out with their favorable RTP rates.

However, the most crucial aspect of online casino gaming is responsible gaming. Always set limits for your spending and time, and never chase losses. Nine Casino provides resources and tools to help you stay in control. It is worth remembering that gambling should primarily be a source of entertainment.

With the right knowledge, a bit of strategy, and a strong commitment to responsible practices, it’s possible to enhance your enjoyment and potentially increase your chances of winning while playing at Nine Casino. So, explore the high RTP games we’ve highlighted, play smart, and most importantly, have fun. Always remember to have fun while gambling and stick to the rules you made.

Categories
Alternative Data & Finance

2025’s Best Mobile Payment Apps Designed for Gamers

Millions of players have helped make the mobile gaming industry a global powerhouse, earning billions yearly. Playing battle royale in PUBG or blackjack games at DraftKings is more than simply having fun; now, gaming involves immersing and interacting smoothly. The evolution depends greatly on mobile payment apps, making it all possible without much attention. Whether you want to purchase a fancy new weapon in Call of Duty or refill your game wallet at an online casino, apps from these stores are developed with you in mind. Because they provide simple, safe, and quick ways to operate, they are reinventing the online business and offering more excitement in gaming.

Apple Pay

Apple Pay shines for Apple fans since it is fully integrated with other Apple products. With Apple Pay, players can send or receive money with their friends (Apple Cash) and make credit purchases with an Apple Card. iPhones and Apple Watches can be used for fast and secure contactless payments with the help of NFC technology. Other than making payments, Apple Pay is a digital wallet for keeping things like gift cards and boarding passes. players are assured that their data is safe because the platform depends only on unique tokens for security and biometric scanning. Yet, some may find that Apple Pay is limited since it’s restricted to Apple gadgets and does not include features for splitting bills. However, Apple’s ease of use, strong security, and speed are why it appeals to its loyal consumers.

Google Wallet

For Android players, Google Wallet is the best option because it offers them a beneficial and straightforward mobile payment experience designed for their needs. Many Android phones come with this app that supports contactless payments in stores and online, ensuring that users can always pay easily. Apart from payments, Google Wallet can hold all necessary cards, tickets, and loyalty cards. In terms of safety, it uses tokenization and encryption to keep your data from being revealed while still being easy to access. However, since you cannot send money from your wallet to friends, you’ll have to find an alternative app. Still, Google Wallet is a favorite wallet app for players because it operates without problems on Android and gives access to useful functions.

PayPal

People prefer to use PayPal when shopping online because it is both secure and in high demand. Since people and companies can use PayPal everywhere and on most devices, it is popular for fast transactions worldwide. PayPal’s rewards program, the card used in stores and on the Internet, and the flexible Pay Later function enhance the purchasing process and add flexibility to your finances. The system offers encrypted transactions and follows strict privacy rules to shield your sensitive data while you make any purchase. PayPal does well online, but it isn’t present in as many point-of-sale systems in stores like some competitors, making it less usable to some. Still, its conveniences and many useful features are why plenty of shoppers pick it for online purchasing.

Samsung Wallet

Samsung Wallet is a convenient and handy digital wallet option for people using Samsung Galaxy phones. It is easy for Samsung Galaxy Buds owners to make contactless payments since they only need to tap their phones against payment devices. Apart from supporting financial transactions, Samsung Wallet stores critical digital items such as IDs, boarding passes, loyalty cards, and car keys in one convenient area. Ensuring that your data remains secure is very important, and you can do so by using fingerprint, PIN, or iris scan authentication. It also connects easily with Samsung Watches so that you can gain more control. Some may not find the service appealing since it is only offered on Samsung devices. Even so, Samsung Wallet provides Galaxy players extra convenience, safety, and multiple features.

Venmo

People use Venmo to handle sharing bills, requesting money, paying rent, or having dinner experiences with friends. Venmo differs from other apps because it has a feed where you can watch your friends’ payments and give them descriptions spiced with emojis. Sending or getting money from friends is simple since players can add their bank accounts or credit cards in a few clicks. Even though its transaction amount is restricted and fees apply for credit card payments, Venmo remains the top choice for easy online payments with friends and family.

Cash App

players looking to handle their finances smoothly and have extra features can choose Cash App. Because it’s so versatile, you can use the app to send and get money and buy things online and in stores with its debit card. Its most important features are the opportunity to invest in stocks and Bitcoin from your phone, attracting people interested in wealth or cryptocurrency. Since the app complies with PCI DSS Level 1, all transactions are guaranteed high-level security, comforting players. Other services on Cash App include filing taxes, paying bills, and applying for loans, making it a complete platform for managing finances.

Related: read more about location data for finance and investment.